

This page describes the new analytics dashboard, which is rolling out to all accounts.
What you will learn
- How to find risky users and users with a High-Risk Event for any period.
- How to read a user card: its band, its High-Risk Events and the devices, visitors and IP addresses linked to it.
- How to read the same account through the History API and act on it at its next sensitive action.
Before you start
- The authenticated snippet on your signed-in pages. Pass a hashed User HID with
checkAuthenticatedUseron every signed-in page. Users, account-level risk and all four High-Risk Events are built on it. See Identify signed-in users. - Access to the analytics dashboard, and your domain’s Private API Key for Step 5 (API keys). No account yet? Start Free with 5,000 identifications, one time, no credit card.
Step 1: Find risky users
Open Overview and pick a period at the top, for example Last 7 days. Two panels answer the first question:- Users splits the accounts active in the period into Trusted, Risky users and High-Risk Event users.
- High-Risk Events shows how many users have each of the four events, Multi-accounting, Account sharing, Impossible travel and Account takeover, at Medium confidence and at High confidence, counted for the users active in the selected period.
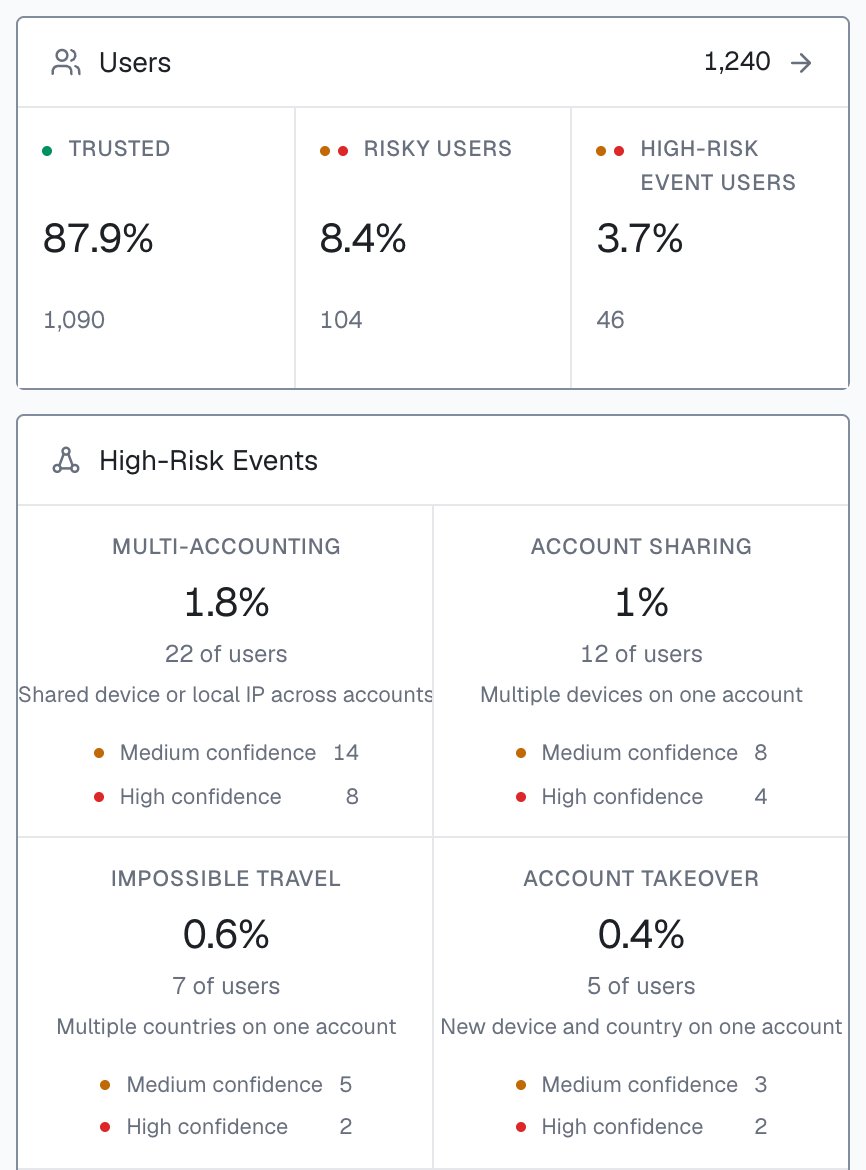
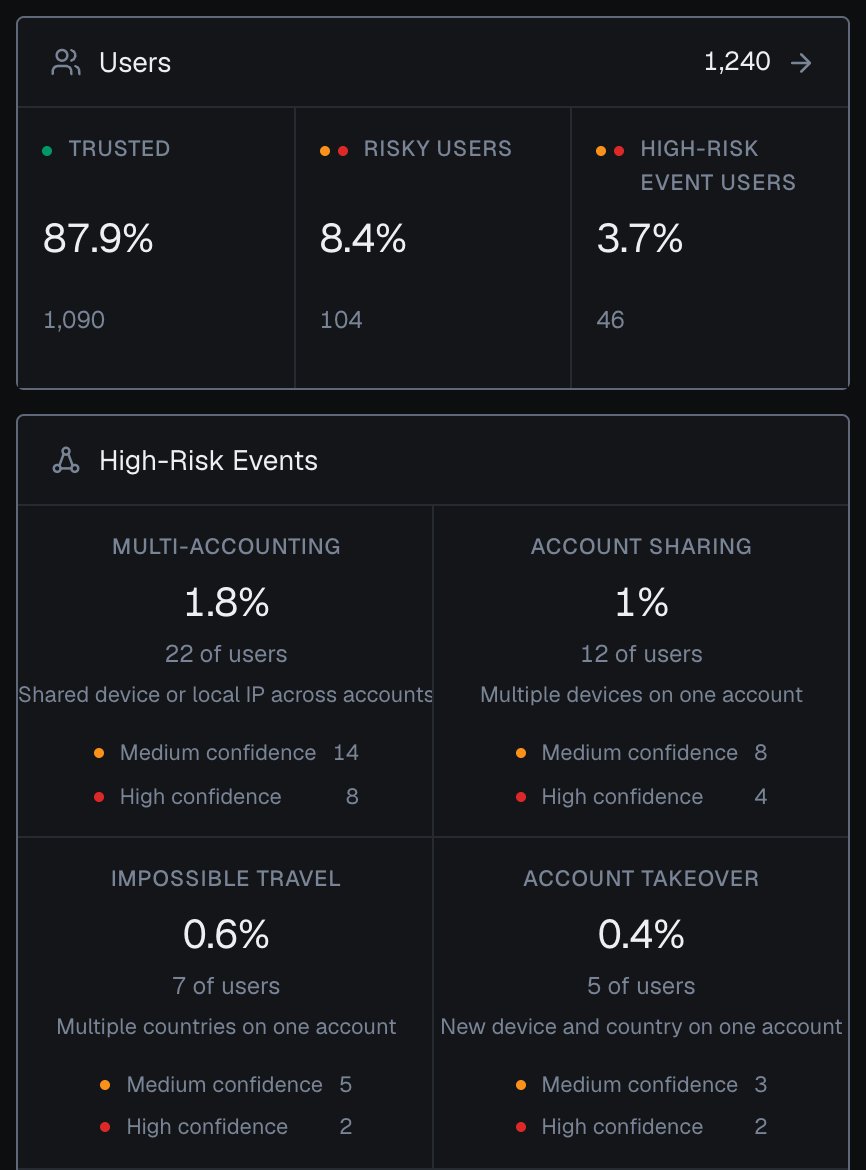
Users and High-Risk Events on the Overview screen of the analytics dashboard, counted for the users active in the selected period.
Step 2: Narrow the list
In Analytics, on the Users tab, narrow the list one of two ways:- By event. Open Filters, pick High-Risk Events, tick Multi-accounting and select Done. The table keeps the users with that event.
- By band. Select the Dangerous band pill to keep the users with at least one Dangerous identification in the period.
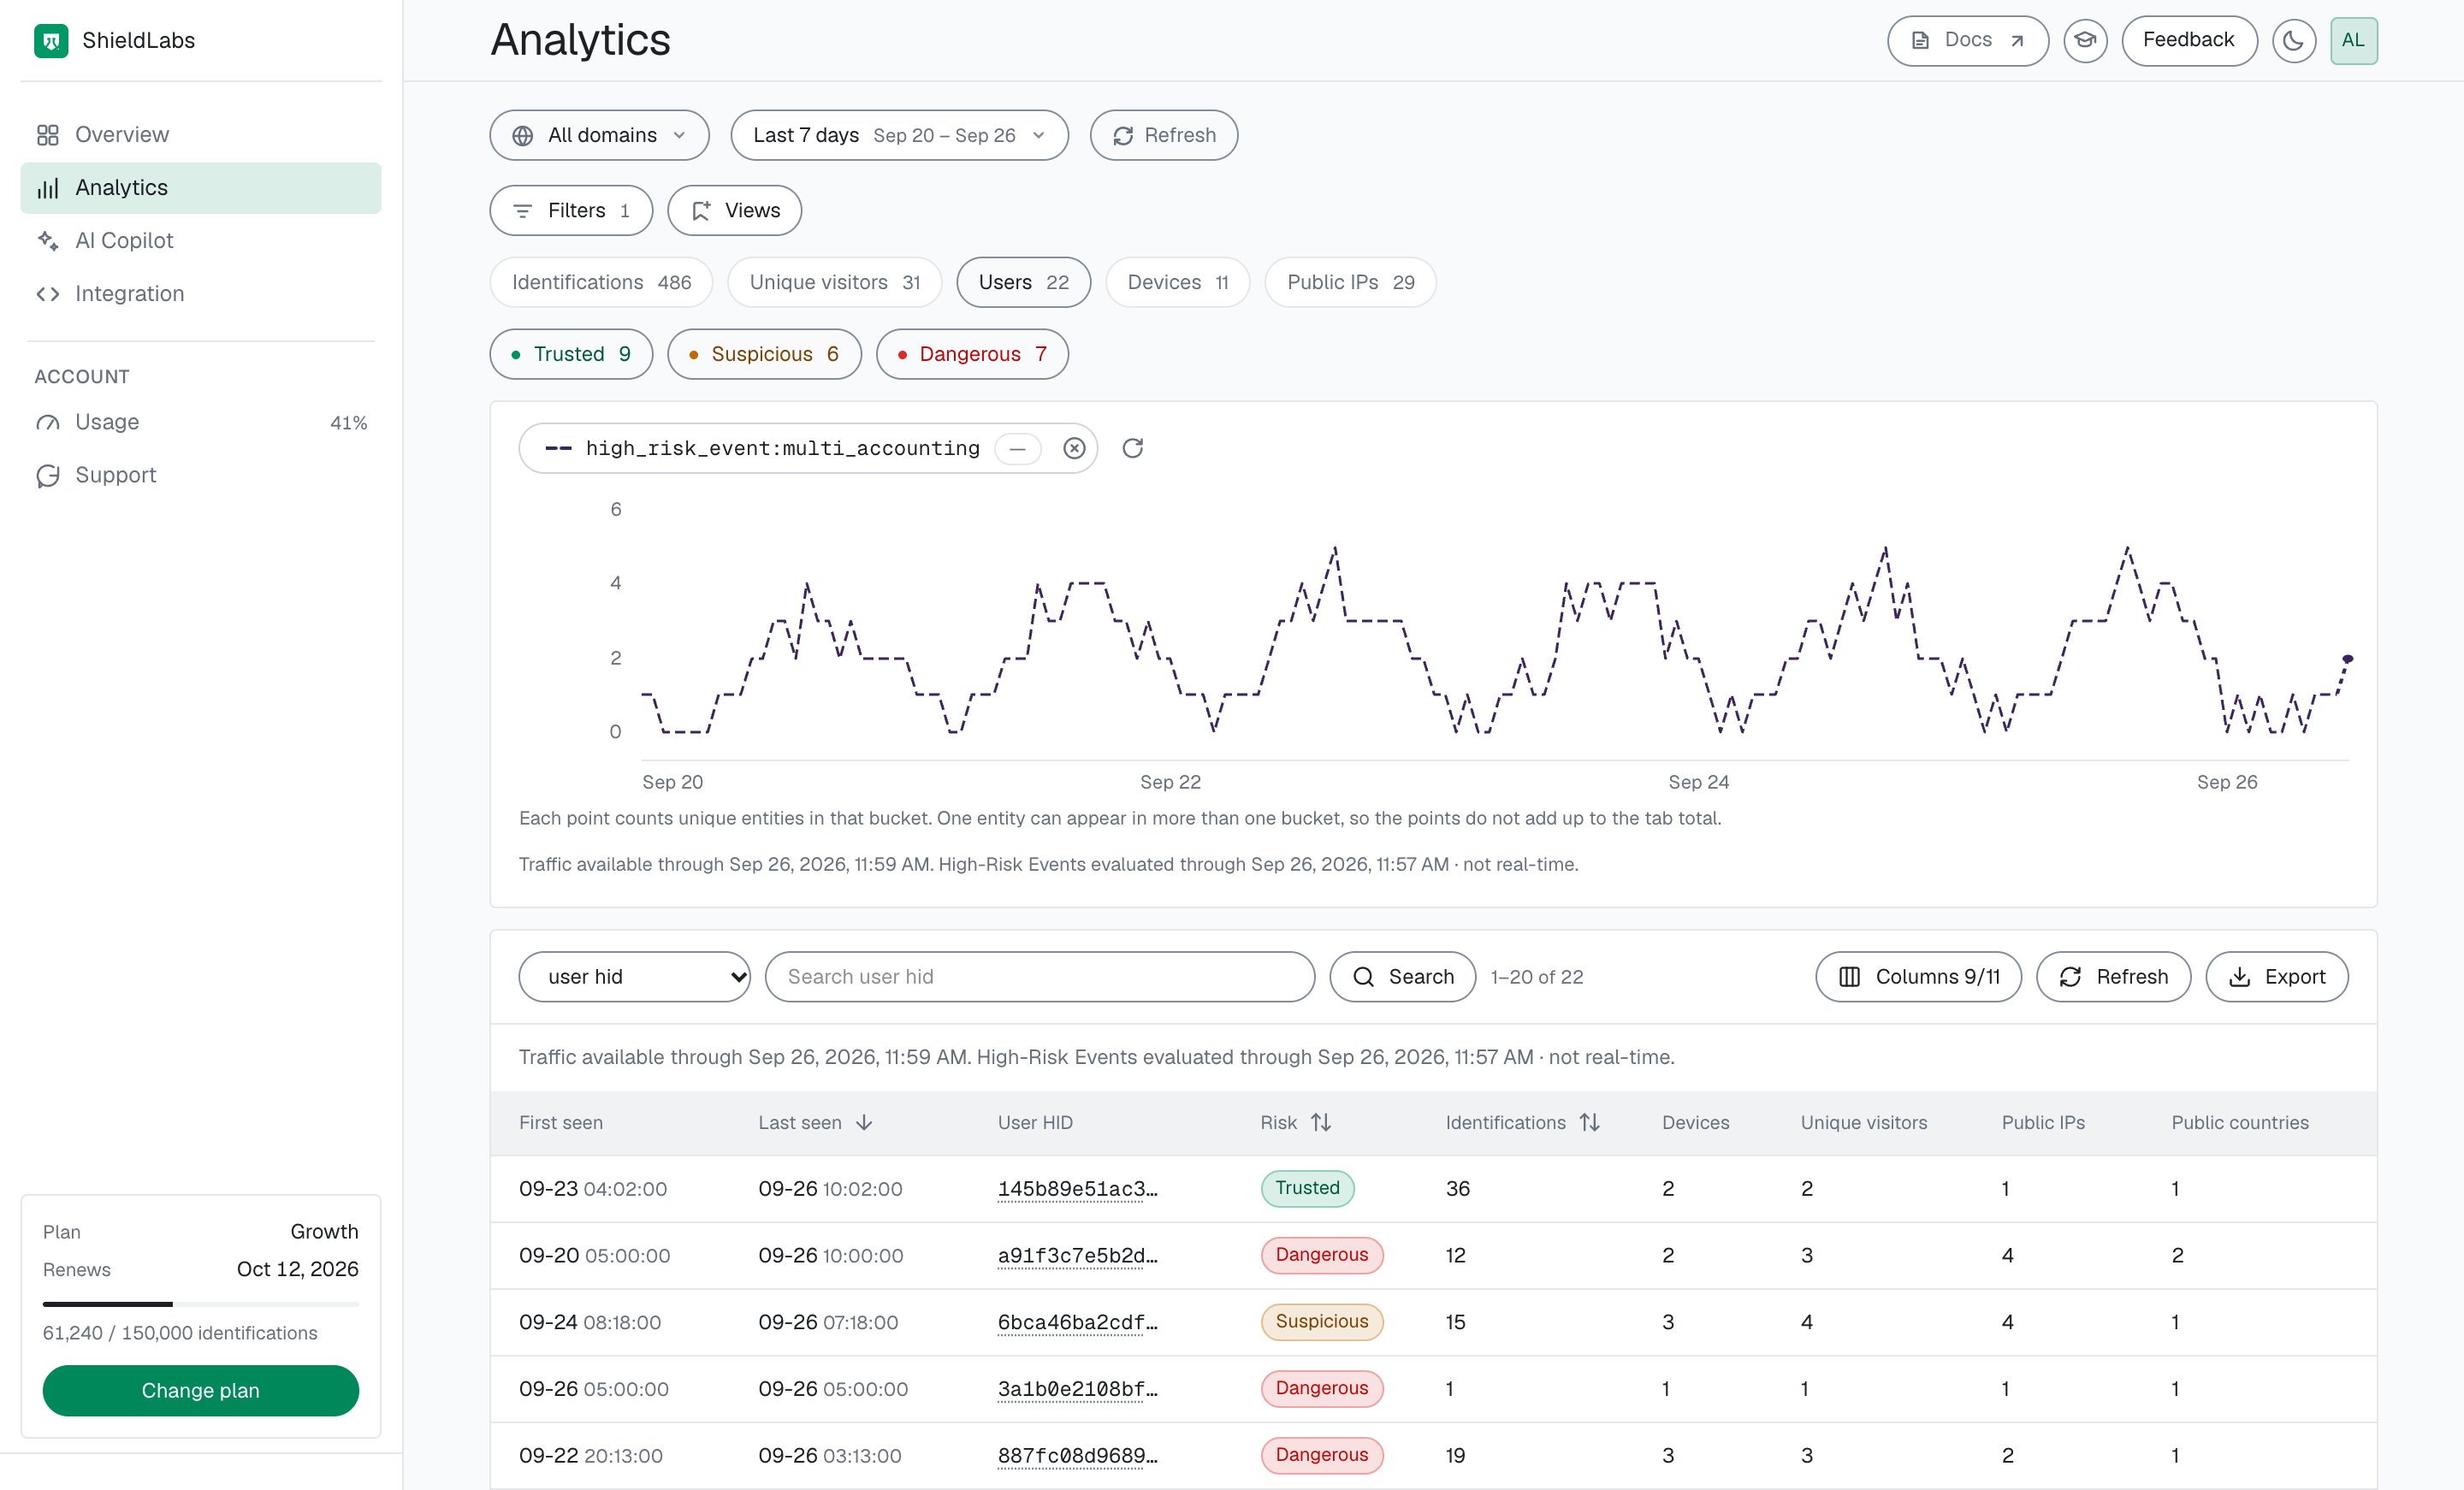
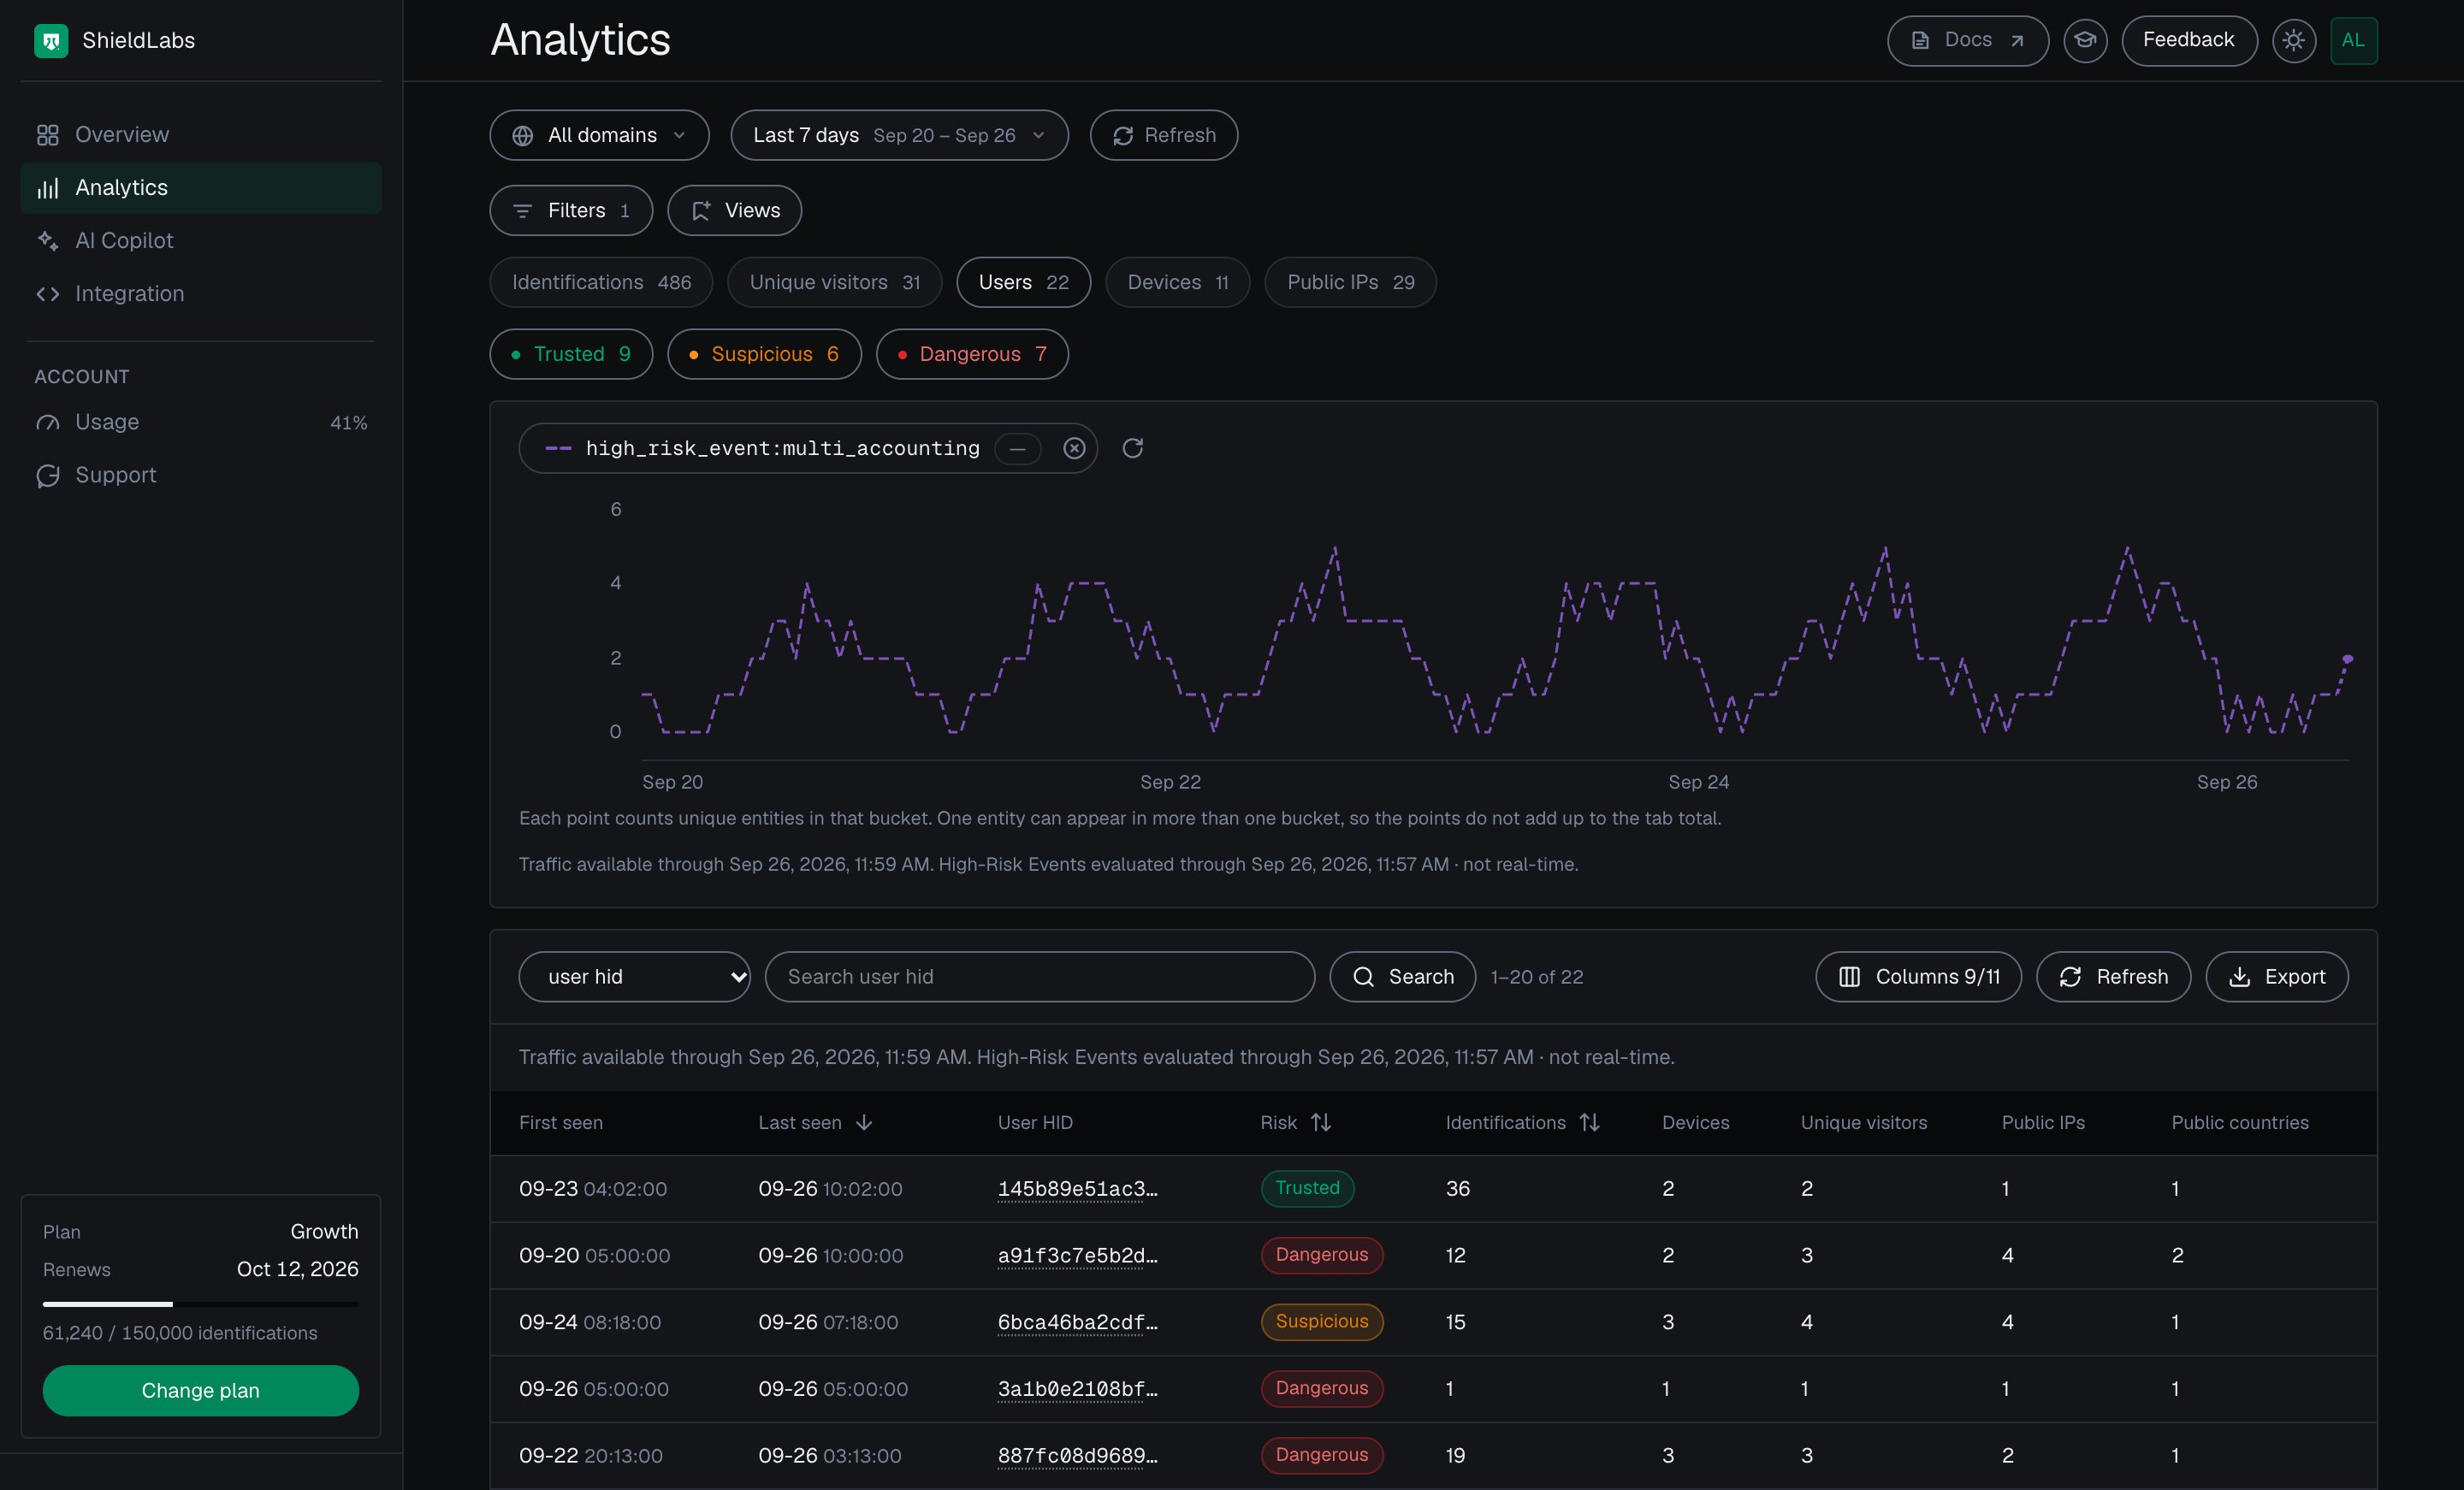
Users with a Multi-accounting event in the analytics dashboard.
Step 3: Open the user card
Select a User HID in the table to open its user card. Read three things, numbered on the screenshot:- The band: the worst band of the user’s identifications in the period. The band split under it shows how many identifications fell in each band, so one Dangerous identification among ten Trusted ones stands out.
- The High-Risk Event: the pill names the event, and its colour gives the confidence, red for High and orange for Medium. These are the colours of the Dangerous and Suspicious bands, but the pill is an event, separate from the band.
- Linked devices: open the counter to list every device the account used, each with the band of the account’s identifications on it. Open a device to see every other account on it under Linked accounts.
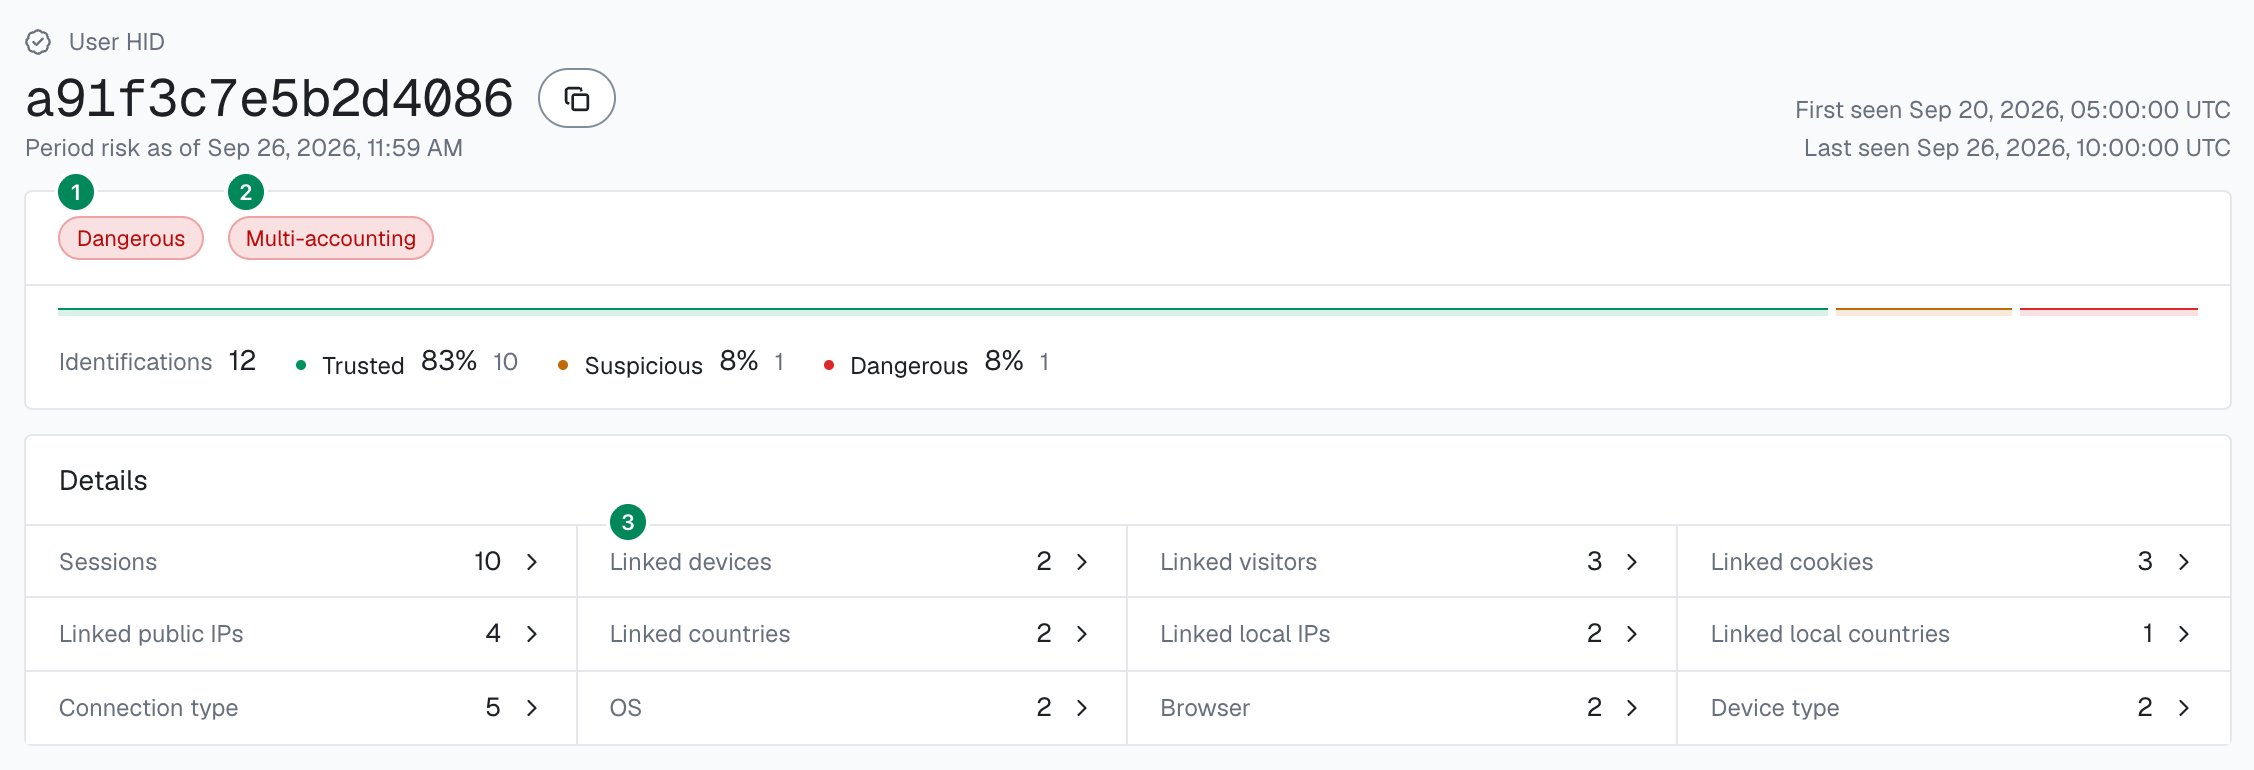
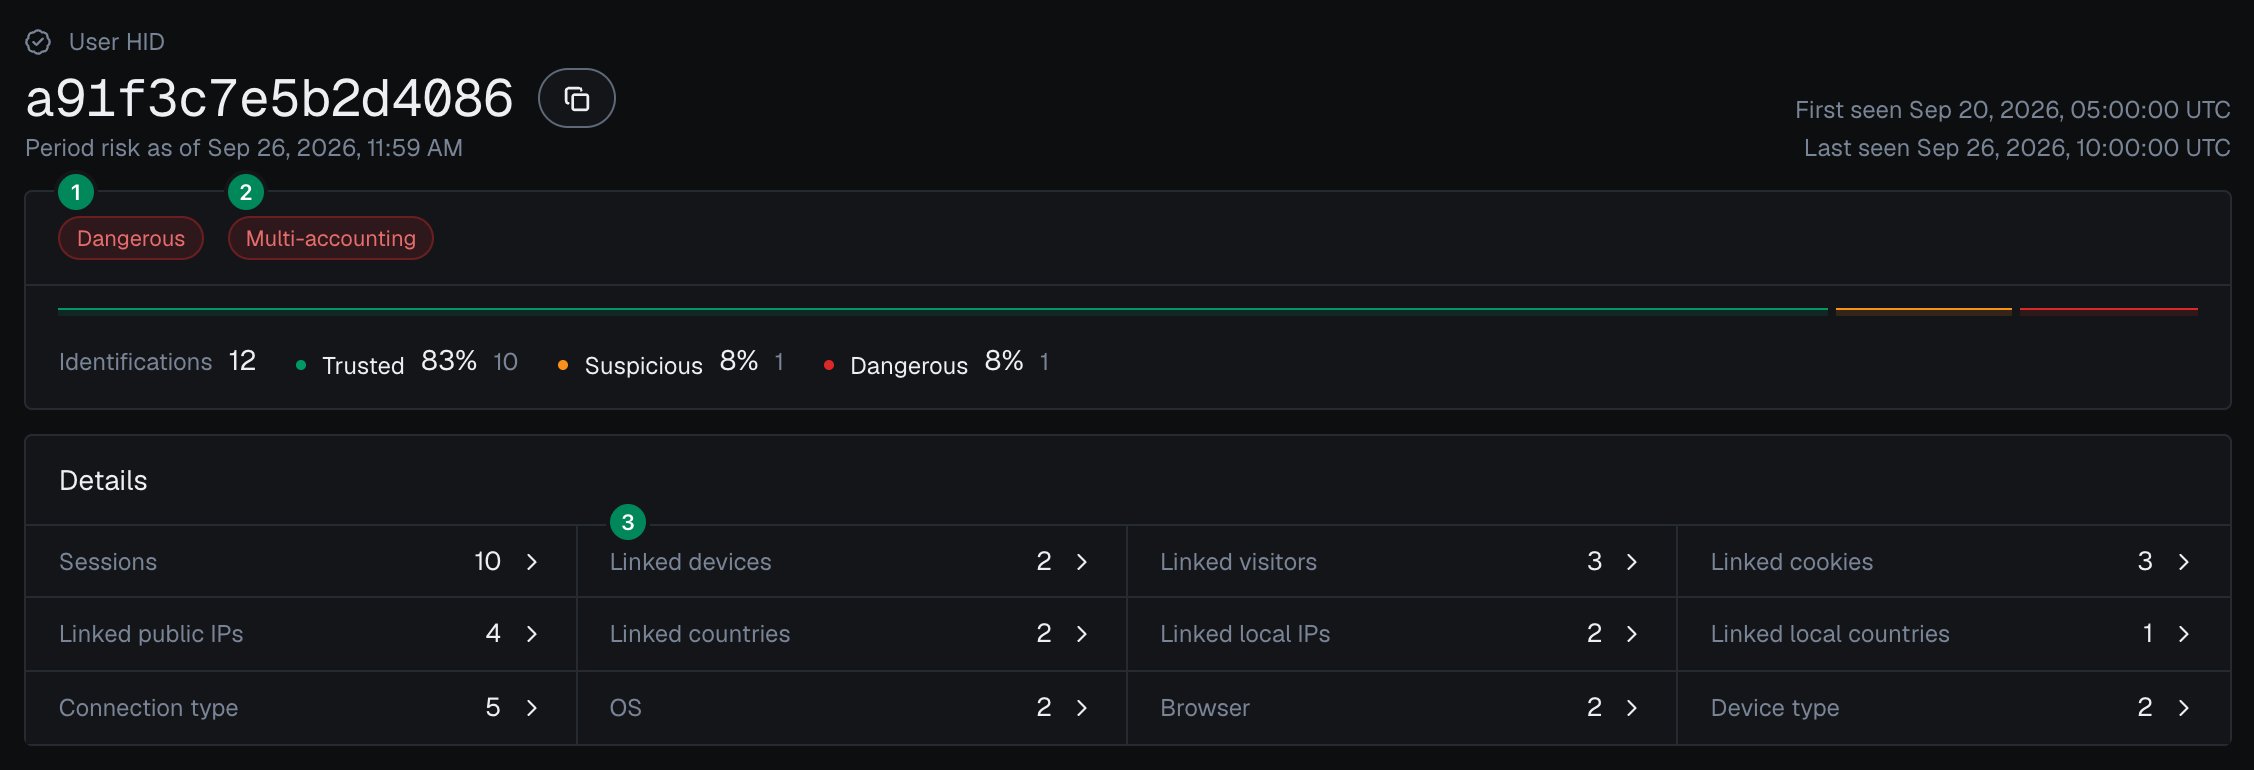
The user card in the analytics dashboard: 1 its band for the period, 2 its High-Risk Event (red pill: High confidence), 3 the devices linked to it.
Step 4: Check what drove the band
Scroll to Identifications at the bottom of the user card and expand the Dangerous identification (its Risk Score column shows the band). The expanded identification card shows the Risk Score and each risk signal with its weight: here Anti-detect Browser (60) and Proxy (10) make 70, Dangerous. Read a high Risk Score together with its named risk signals and the user’s history. A real customer on a corporate VPN can reach the Suspicious band; the signals show why, and you choose the action for each case.

The Risk Score of one identification and each risk signal with its weight, in the analytics dashboard.
Step 5: Act in your backend
High-Risk Events are available in the analytics dashboard, the API and webhooks. When you review one in the analytics dashboard, as in the steps above, act on the account: read it in your backend by its User HID, record your decision, and check that record at the account’s next sensitive action. The Risk Score and risk signals of the identification remain the input at that action.1
Read the account
Read every identification of the account from the History API by In code, the Read every identification of one account covers paging with
user_hid. Reads use none of your included identifications.accountView and accountsBehindDevice helpers from the tutorials overview roll the newest 100 identifications up into an account view like the one on the user card:offset.2
Record your decision
Store the account and the devices linked to it, with the reason you saw in the analytics dashboard.
3
Check it at the next sensitive action
At a payout, a promo claim or a signup bonus, check the incoming identification against your watchlist, next to its own Risk Score and risk signals. Choose the action for each case (allow, step up, review or block) in your backend. ShieldLabs stops fraud and abuse and helps block fraudulent and abusive traffic.
waitForScore and band are helpers from the tutorials overview as well.Summary
- The Overview’s Users and High-Risk Events panels show how many accounts need a look in the period.
- Analytics narrows them by event or by band, and the user card shows the account’s band, its High-Risk Events and every device, visitor and IP linked to it.
- The identification card shows the risk signals and weights behind the band.
- In your backend, read the account by
user_hid, record your decision, and check it at the account’s next sensitive action.
Next steps
User and device cards
Everything on a user, device, visitor or IP card.
High-Risk Events
The four events detected on your users, at Medium or High confidence.
Acting on High-Risk Events
Turn a reviewed event into an action in your backend.
Users, devices, visitors and IPs
The five identities and how they link.
Risk signals
Every risk signal with its weight.
Multi-accounting tutorial
Catch one person running many accounts at signup and at the reward.