

data.signals array (name + weight) and, for most risk signals, a matching boolean in data.detection_flags. Branch on name, detection_flags and the Risk Score band in code to choose the action for each case: allow, challenge, review or block. Risk Scoring explains how the weights roll up.
Network and masking
These risk signals show that the connection is relayed, tunneled or coming from infrastructure rather than an ordinary home or mobile network.Consistency and mismatch
These risk signals show that two readings of the same identification disagree, which is what spoofed or relayed traffic leaves behind.Environment
These risk signals show that the runtime is spoofed, stripped, automated or could not be fully verified.Bots and automation
ShieldLabs detects bot and AI traffic: it identifies bots, automated traffic and AI agents, and separates bad bots from good ones. On the webhook, three keys carry it, and an AI agent that drives a browser arrives as automated traffic, onbrowser_automation or javascript_disabled:
The analytics dashboard counts unique visitors with the first two: Good bots for search-engine crawlers and Bad bots for automated browsers, on the Overview screen.
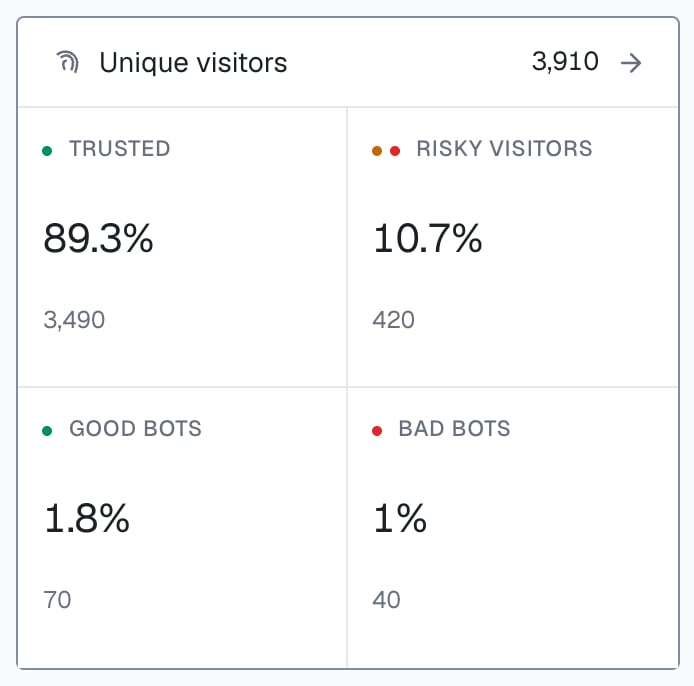
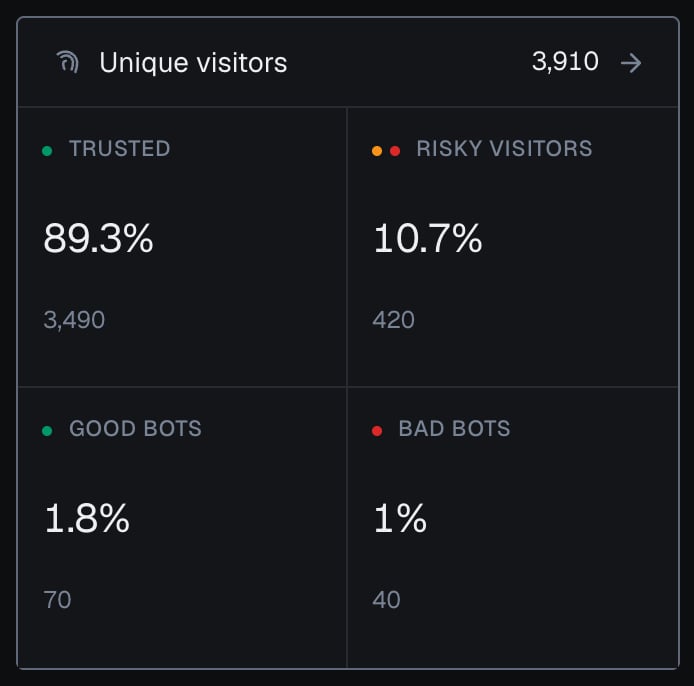
Unique visitors in the analytics dashboard: good bots are search-engine crawlers, bad bots are automated browsers.
Informational flags
These are detected and returned indetection_flags on the webhook with a weight of 0: they add nothing to the Risk Score and never appear in signals.
Weights
Each risk signal adds a fixed weight, and the total is capped at 100. Some risk signals stand in for others instead of adding to them, for example Tor and Privacy Relay, which exclude the other network weights. Risk Scoring lists every weight and the combination rules.Risk signals on users, devices, visitors and IPs
A risk signal fires on one identification, and the user, device, visitor and IP address of that identification carry it with them. To see which risk signals one account arrived with, read its identifications from the History API byuser_hid: each row carries that identification’s score, its score_details breakdown, the is_* flags and the connection_type. Search by device_id, visitor_id or ip the same way for a device, a visitor or an address. Users, devices, visitors and IPs explains how the identities link.
In the analytics dashboard, filter the Users, Devices, Unique visitors or Public IPs tab of Analytics by Risk signals to list the users, devices, visitors and IPs that arrived with a risk signal in the selected period, each with its band. A user’s card shows its High-Risk Events, and each identification card names its risk signals with their weights.
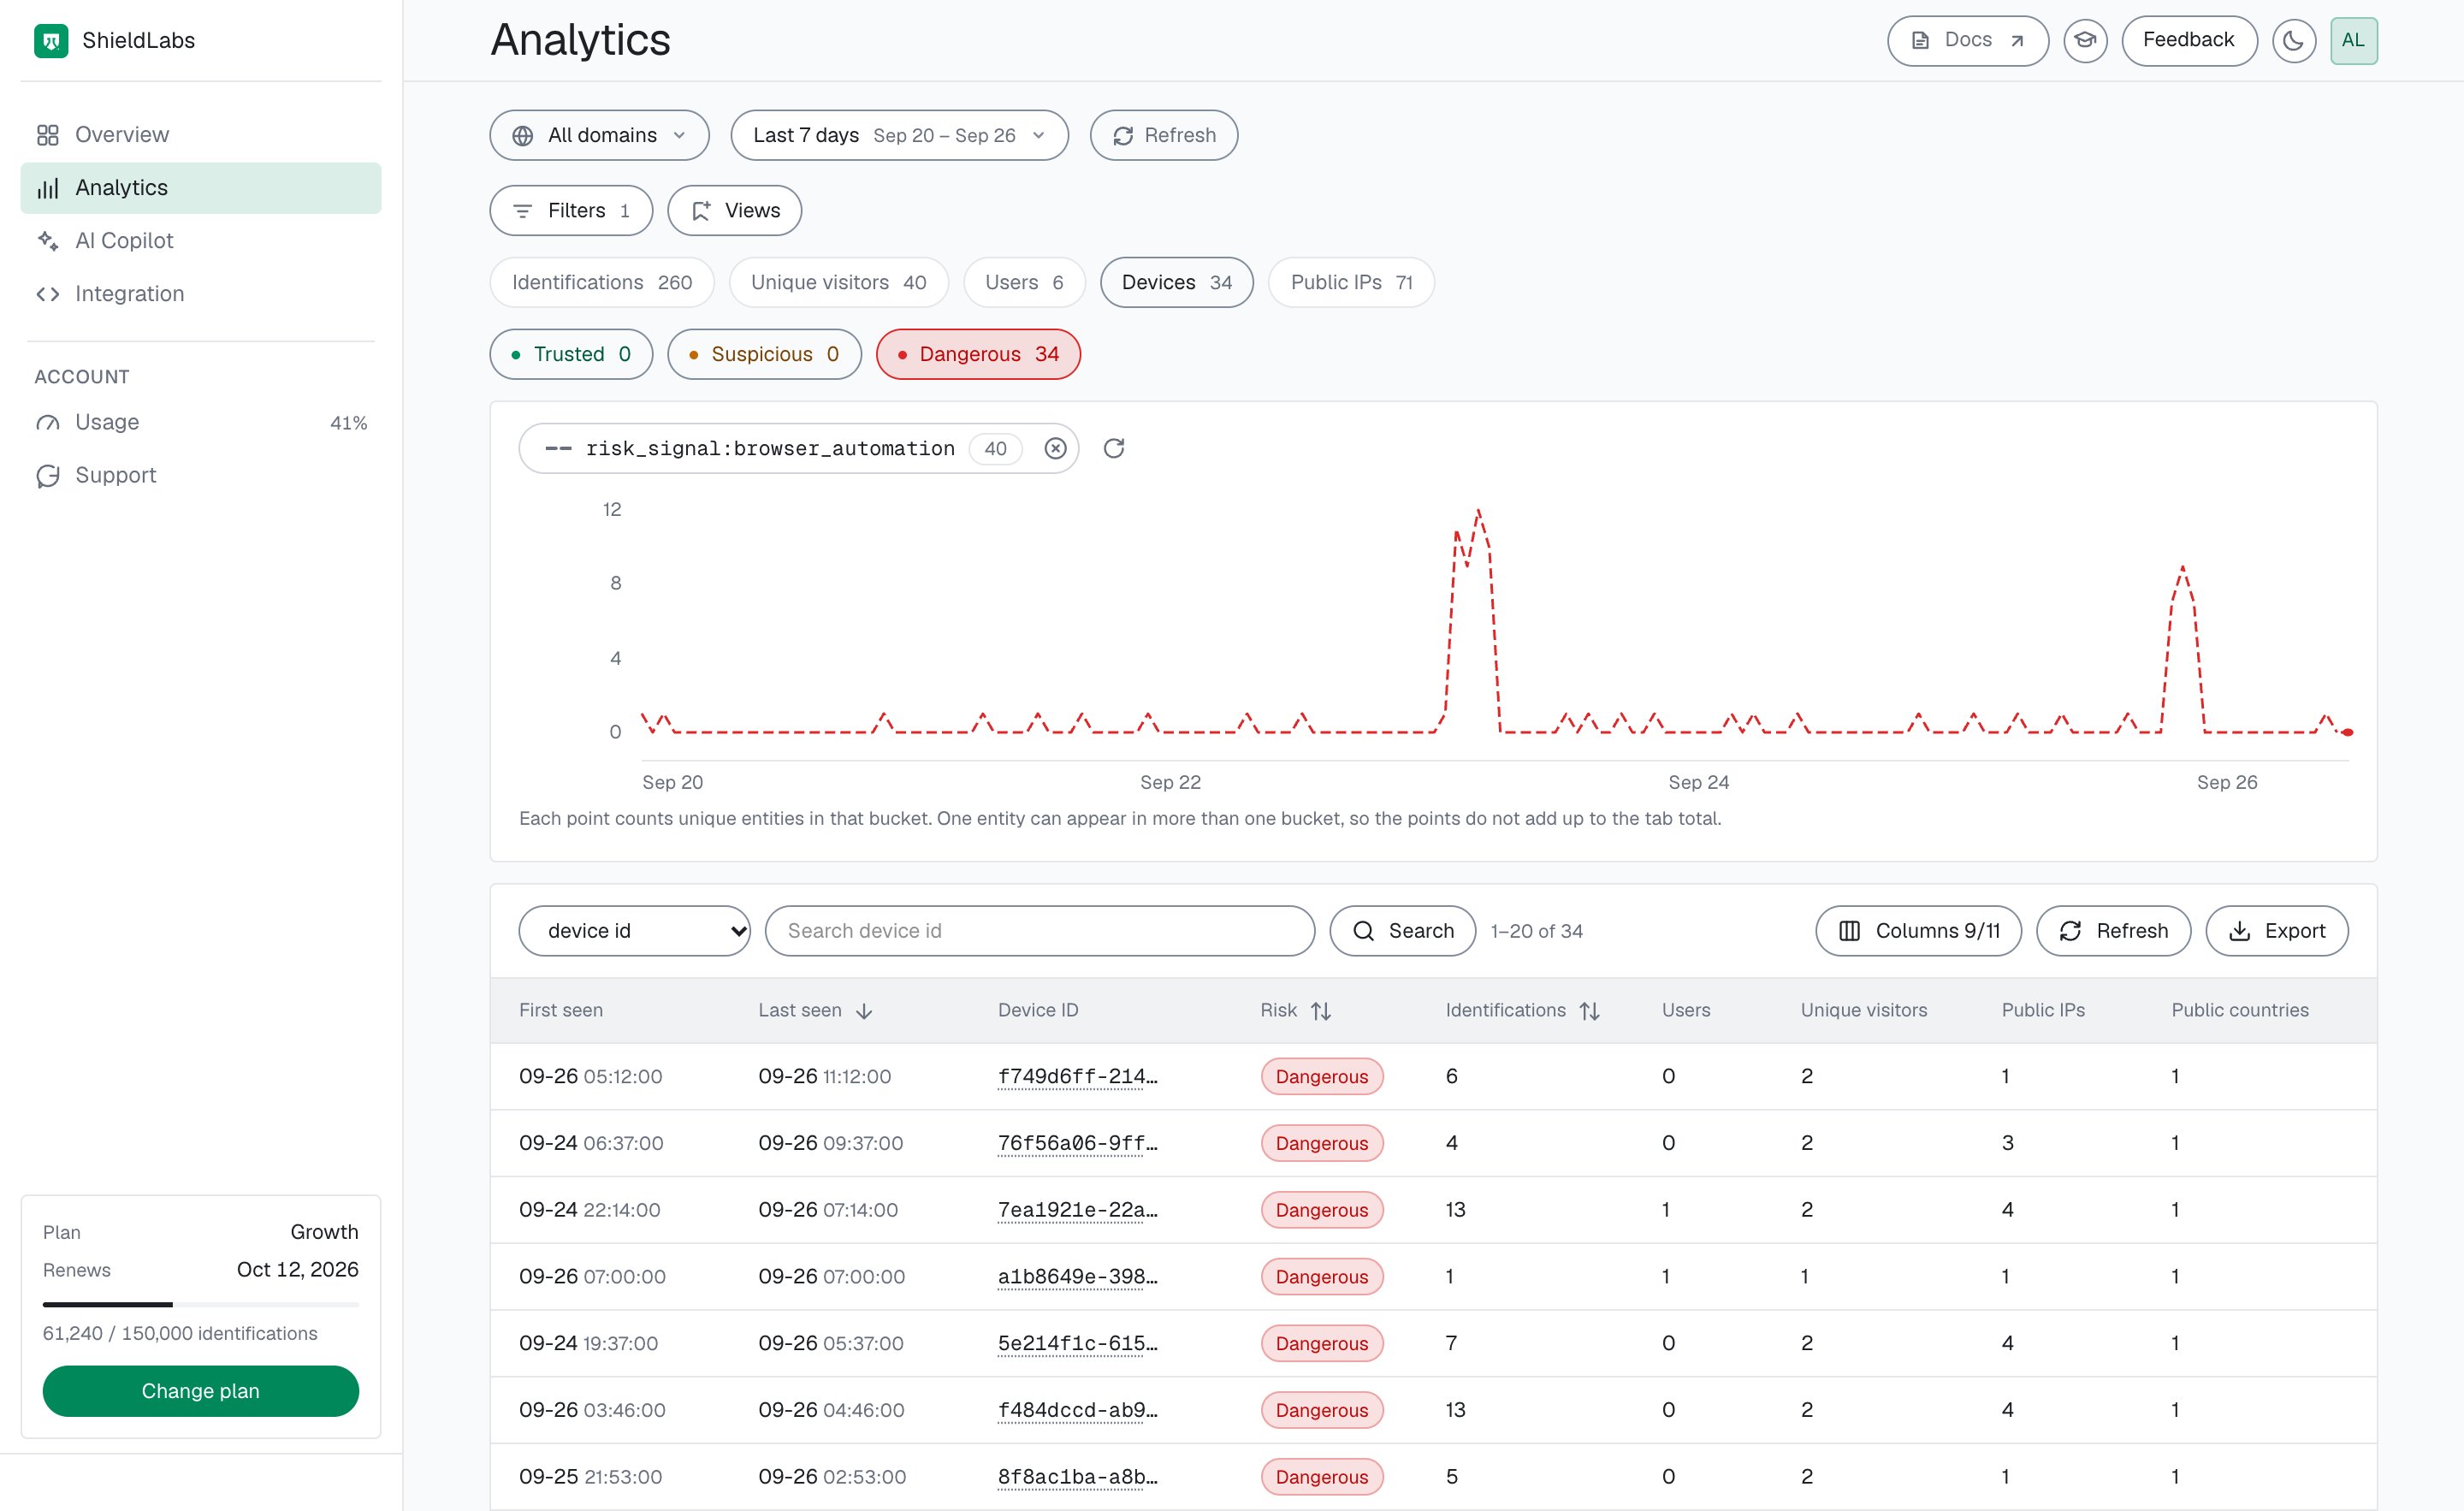
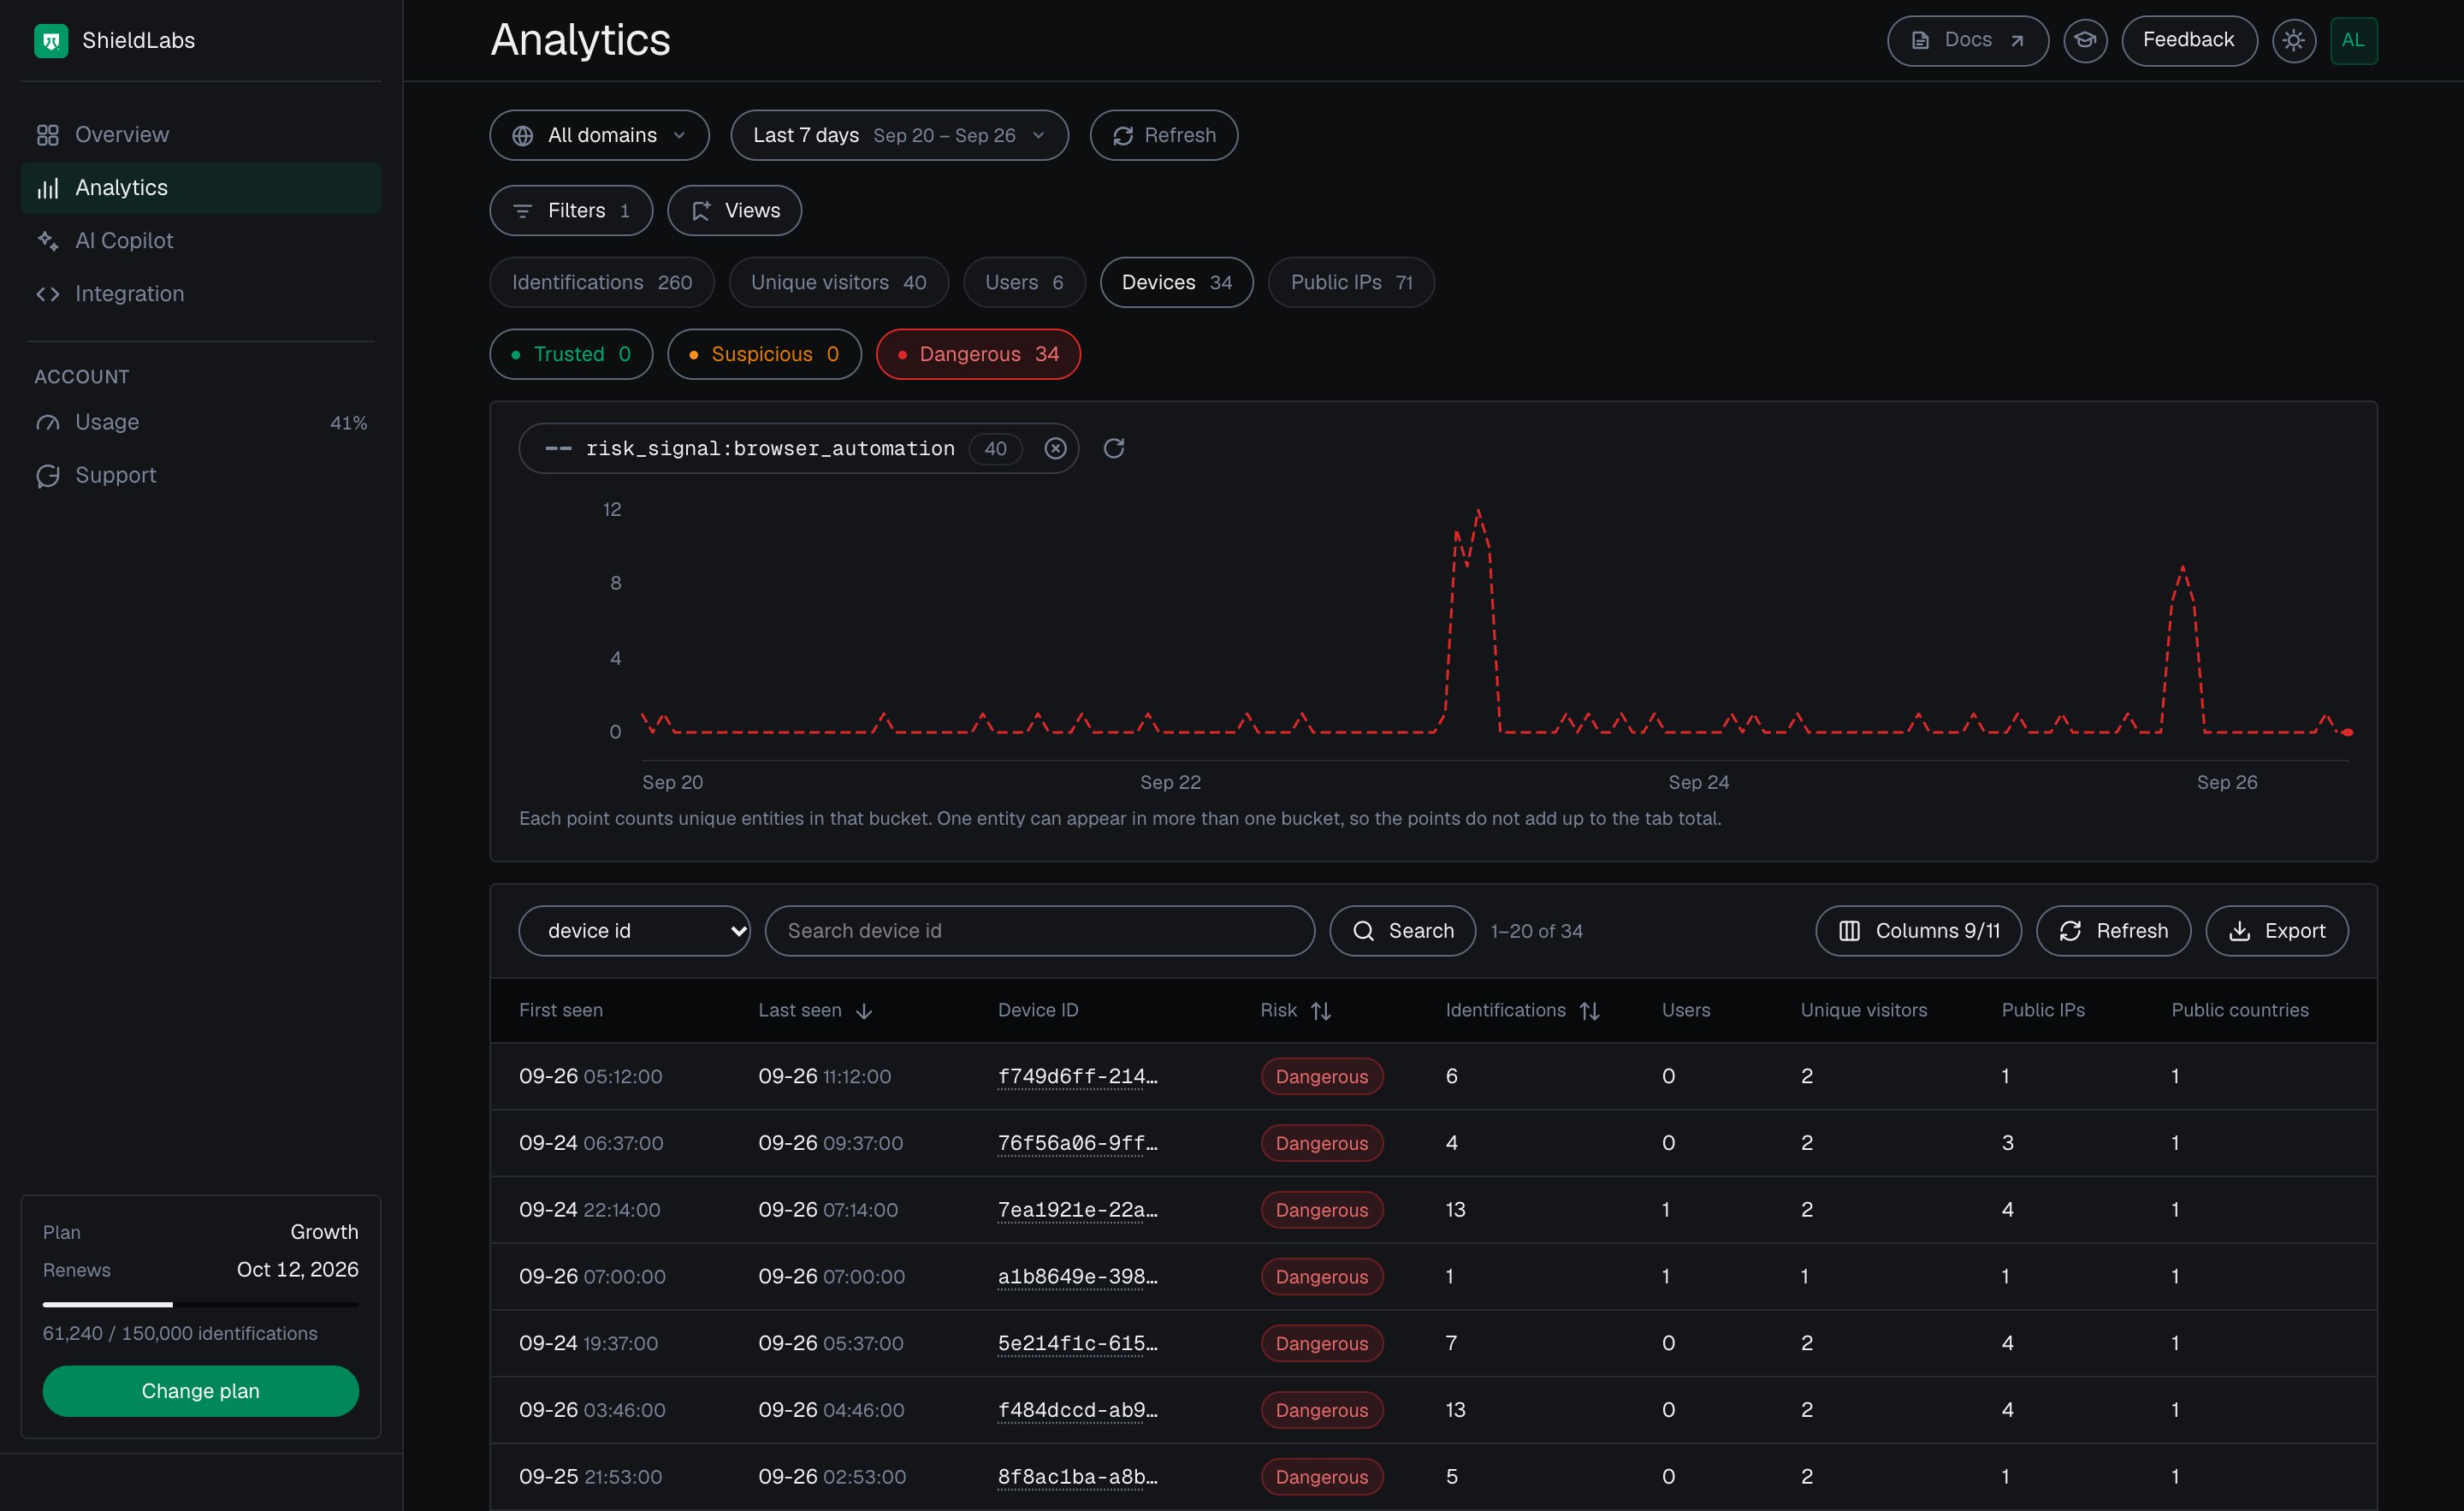
Devices with automated sessions in the period, in the analytics dashboard.
Connection type
Every identification also carries one connection type, the headline label for how it reaches you:connection_type on the webhook and on each History API row.
connection_type is one of: Direct, Mobile, VPN, Proxy, Tor, Privacy Relay, Browser VPN/Proxy or Unknown (when the type could not be resolved). The analytics dashboard breaks traffic down by connection type.
The connection type is a summary. The
signals array is the full breakdown: one identification can carry a proxy connection type along with a datacenter and abuser flag underneath it.Masking and legitimate users
Read a high Risk Score together with its named risk signals and the user’s history. A real customer on a corporate VPN, iCloud Private Relay or a privacy-focused browser can reach the Suspicious band; the risk signals show why, and you choose the action for each case. Because every risk signal is named, you can choose a different action for a Privacy Relay, a Tor exit and a datacenter IP: all are masking, with different intent.Example
Thedata object of a webhook for an identification from an anti-detect browser behind a VPN, shortened:
Webhook
signals[].name is a stable slug (vpn, antidetect_browser). Branch on that slug or on detection_flags (anti_detect_browser for the flag). Display labels such as “Anti-detect Browser” appear in the analytics dashboard. On the History API, score_details is a JSON string of internal descriptions (for example Is proxy) that also contains debug entries: store it for review, but never branch on it or show it to your users. Branch on the slug, never on a label.user_hid and device_id let you check in the History API whether this account keeps arriving through anti-detect browsers.
Next steps
Risk Scoring
How risk signal weights roll up into the 0 to 100 Risk Score and the Trusted, Suspicious and Dangerous bands.
High-Risk Events
Multi-accounting, account sharing, impossible travel and account takeover, detected on your users at Medium or High confidence, a separate axis from risk signals.
Users, devices, visitors and IPs
How each identification links to a user, a device, a visitor and IP addresses, each with its own risk.
Acting on results
Turn the Risk Score, its risk signals and the user’s history into an action for each case.