> ## Documentation Index
> Fetch the complete documentation index at: https://docs.shieldlabs.ai/llms.txt
> Use this file to discover all available pages before exploring further.
# Overview
> See how clean your traffic is, how many of your users are risky or have a High-Risk Event, and where risk comes from.
This page describes the new analytics dashboard, which is rolling out to all accounts.
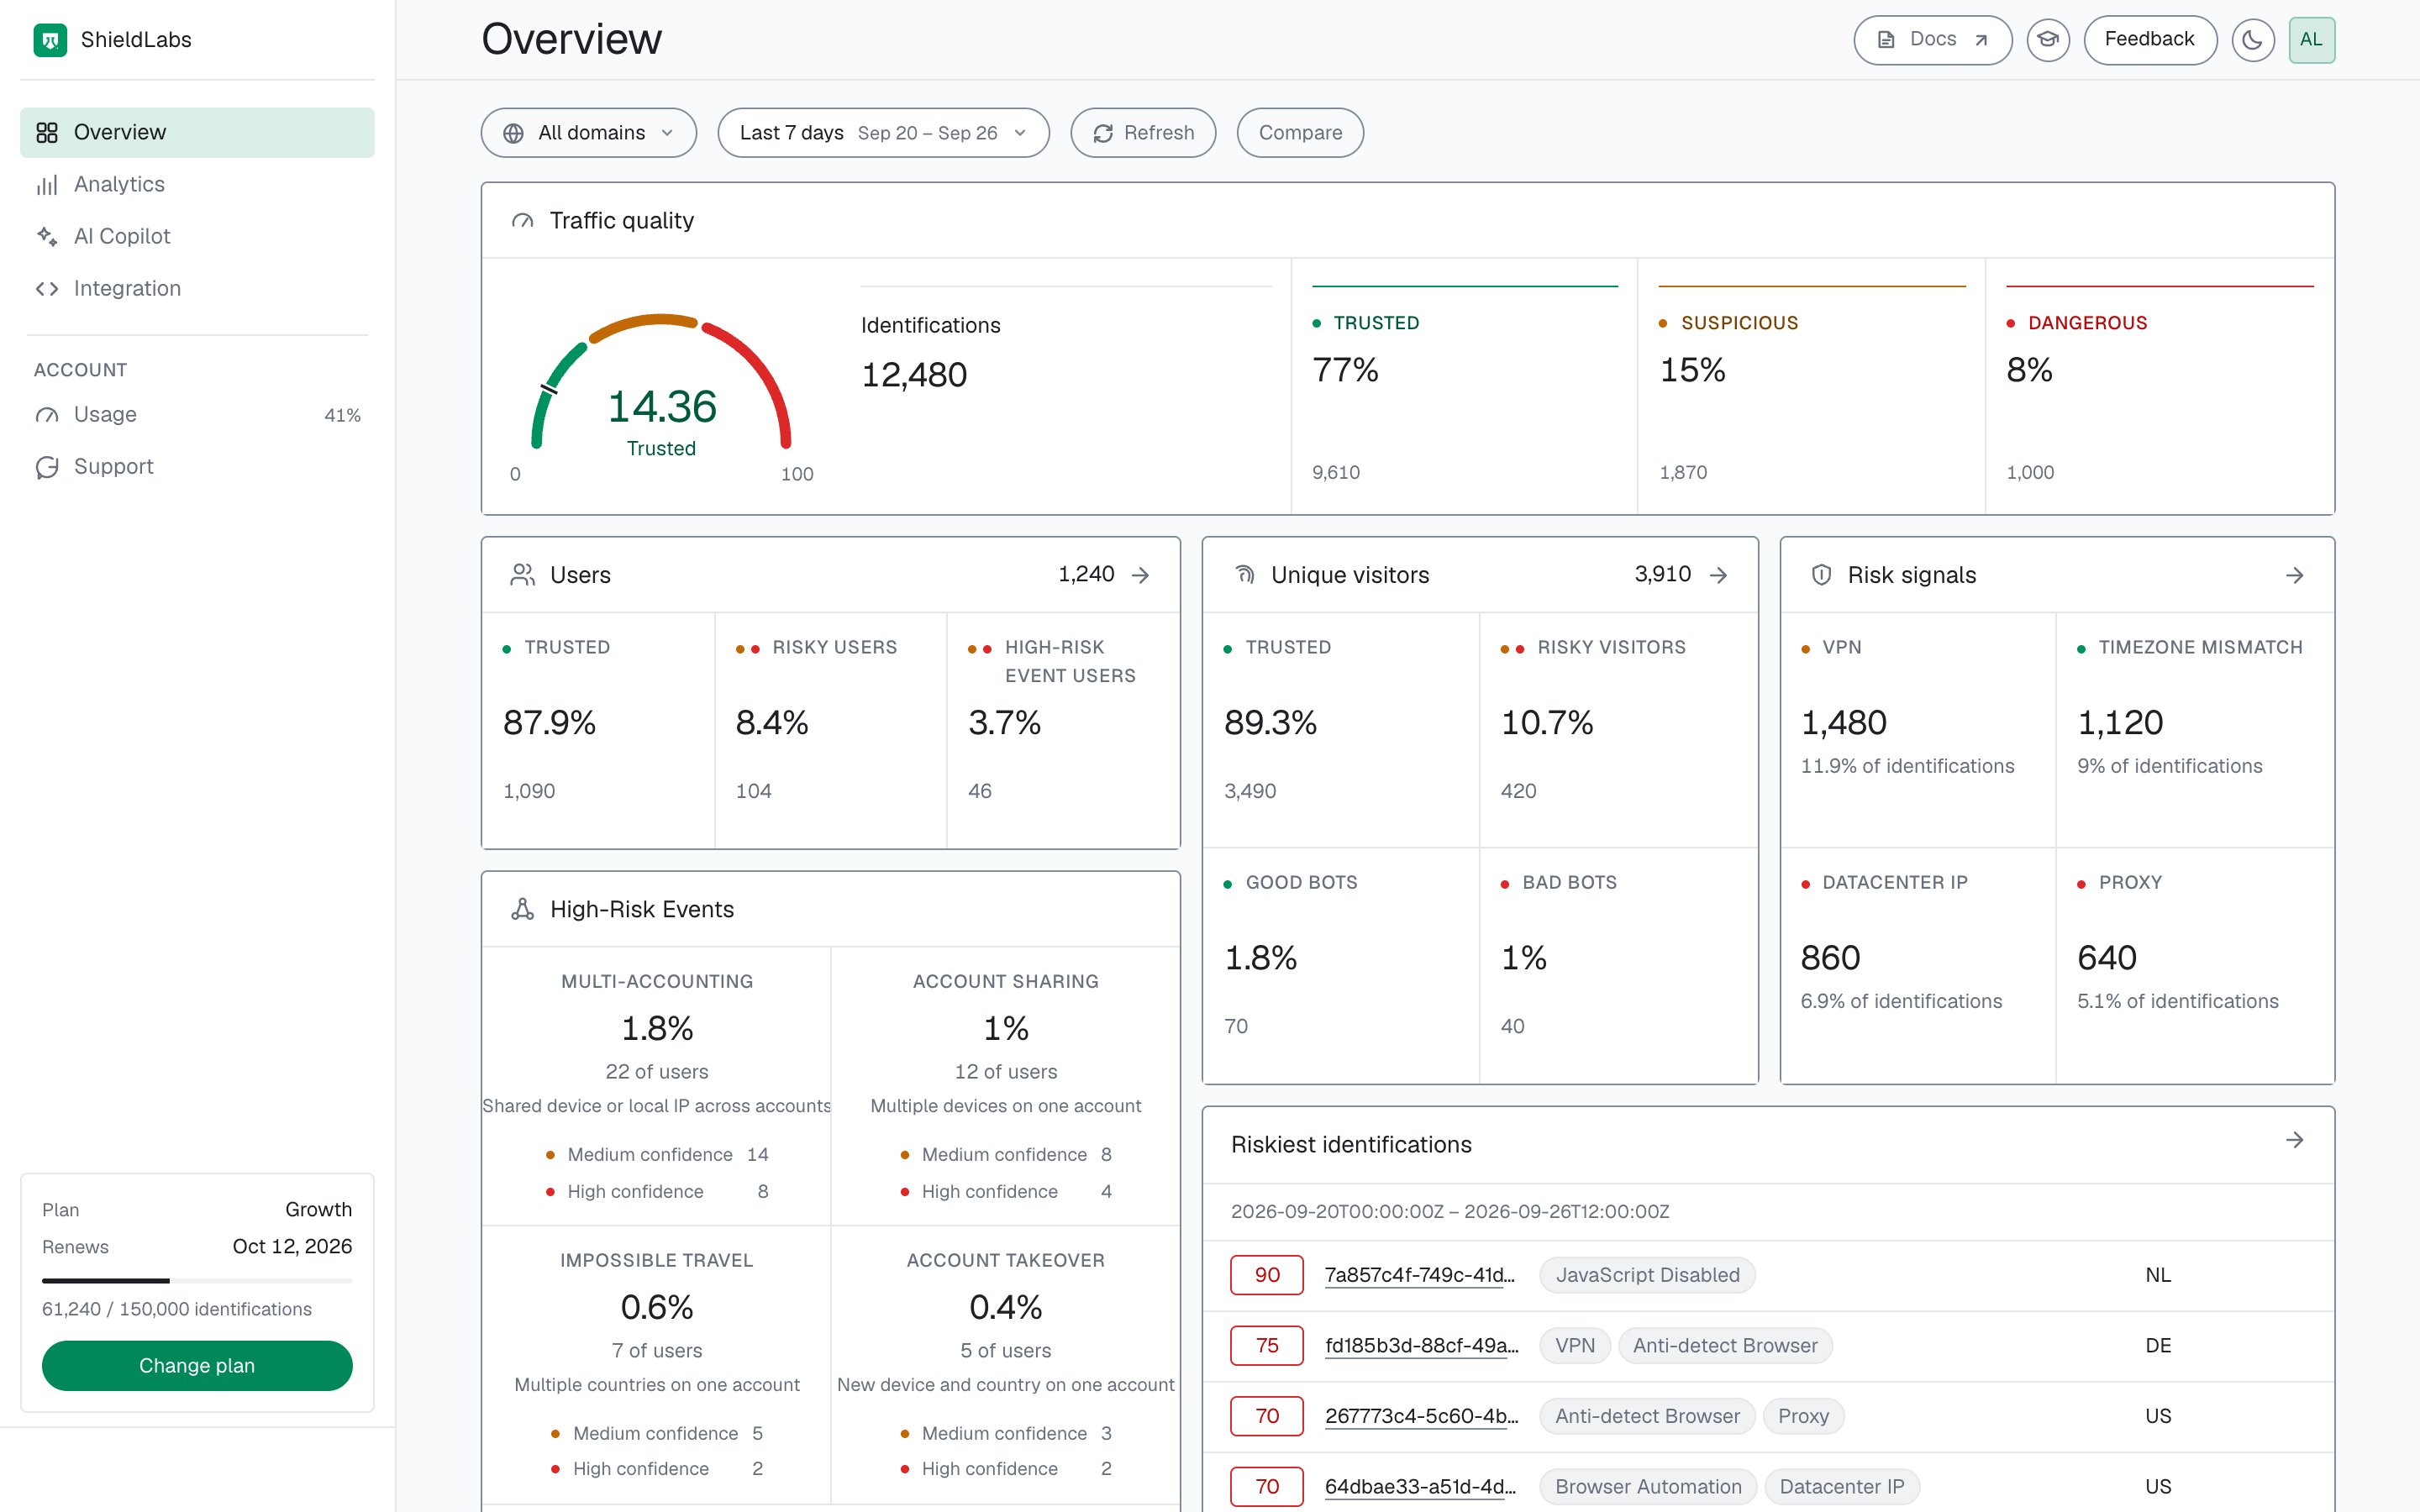
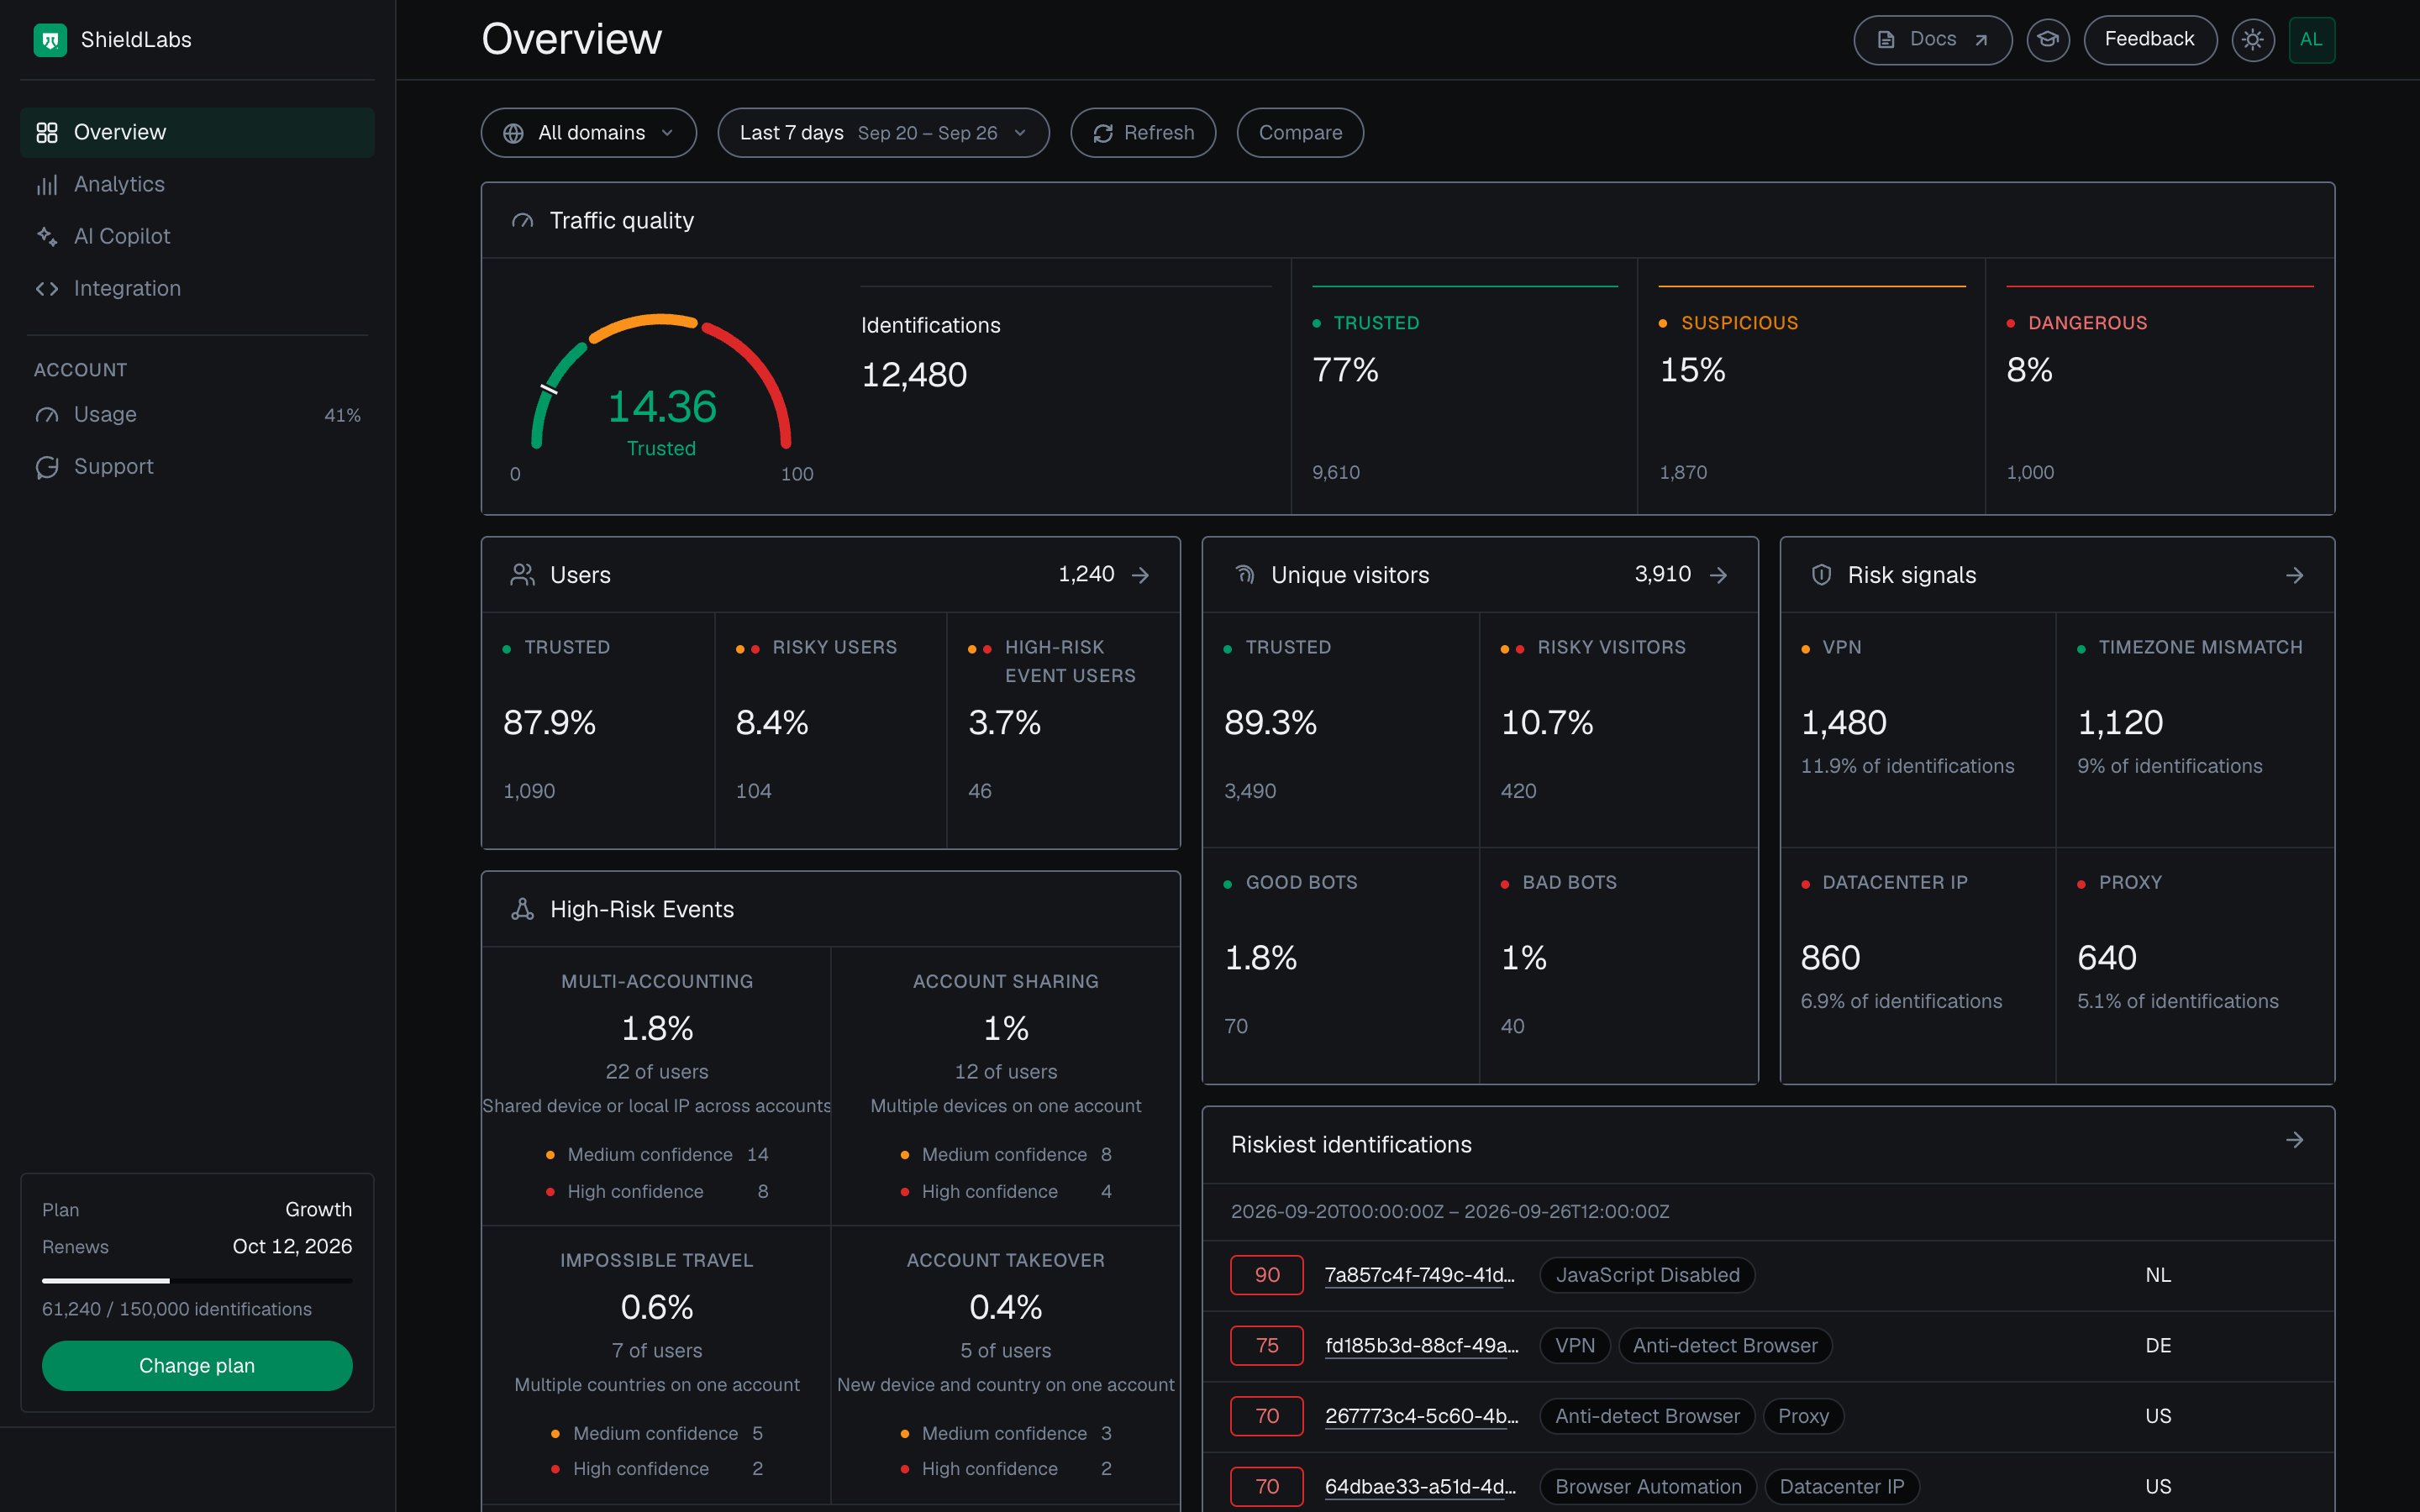
The Overview screen of the analytics dashboard answers four questions for the period you pick: how many of your users are risky or have a High-Risk Event, how clean your traffic is, which risk signals fire most, and where risky traffic comes from. Your users come first: each one is an account you identify with a hashed User HID, and each carries the worst band of its identifications in the period. Every tile opens Analytics with the matching filter. On the traffic quality, users, unique visitors and risk signal tiles, the figure on the tile is the count you land on. The analytics dashboard is built for desktop browsers.
 ## Period and domain
The row at the top of the screen sets the scope of every figure below it.
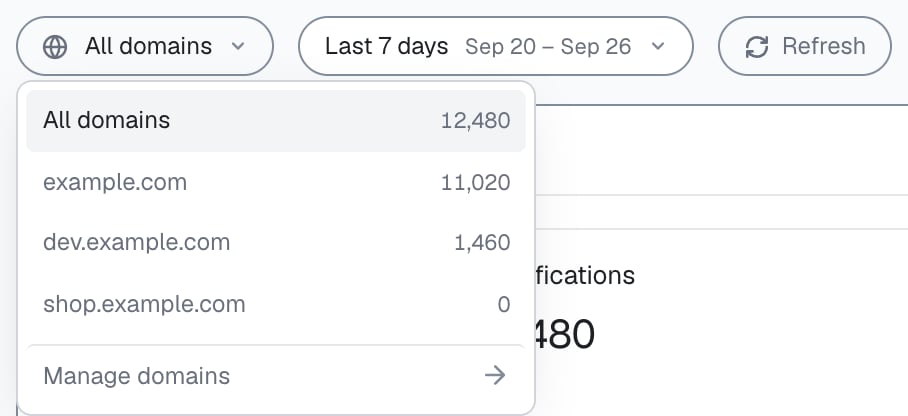
* **Period**: Today, Yesterday, Last hour, Last 24 hours, Last 7 days (the default), Last 30 days, Last 90 days, or **Custom range**. The period selector covers the last 90 days.
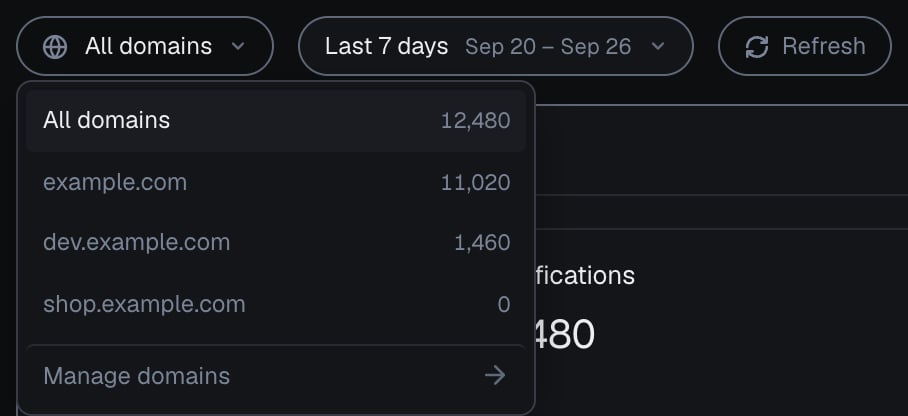
* **Domain**: **All domains**, or one of your domains.
* **Compare**: shows each figure's change against the previous period of the same length. It is off by default.
* **Refresh** reloads the period. A **New data** hint appears when newer identifications have arrived.
Analytics and the user, device, visitor and IP cards keep the same period and domain when you open them from here. AI Copilot keeps the period and reads every domain on your account. The plan usage in the side rail follows your billing cycle, so it stays the same whatever period you pick.
## Period and domain
The row at the top of the screen sets the scope of every figure below it.
* **Period**: Today, Yesterday, Last hour, Last 24 hours, Last 7 days (the default), Last 30 days, Last 90 days, or **Custom range**. The period selector covers the last 90 days.
* **Domain**: **All domains**, or one of your domains.
* **Compare**: shows each figure's change against the previous period of the same length. It is off by default.
* **Refresh** reloads the period. A **New data** hint appears when newer identifications have arrived.
Analytics and the user, device, visitor and IP cards keep the same period and domain when you open them from here. AI Copilot keeps the period and reads every domain on your account. The plan usage in the side rail follows your billing cycle, so it stays the same whatever period you pick.
 ## Traffic quality
The gauge shows the average Risk Score of the period's identifications, with its band: Trusted (0 to 29), Suspicious (30 to 59) or Dangerous (60 to 100). Next to it, **Identifications** counts every identification in the period, and **Trusted**, **Suspicious** and **Dangerous** split them by band, each with its share. Together they answer the first question: how clean is my traffic in this period? Select a band tile to open those identifications in Analytics.
## Traffic quality
The gauge shows the average Risk Score of the period's identifications, with its band: Trusted (0 to 29), Suspicious (30 to 59) or Dangerous (60 to 100). Next to it, **Identifications** counts every identification in the period, and **Trusted**, **Suspicious** and **Dangerous** split them by band, each with its share. Together they answer the first question: how clean is my traffic in this period? Select a band tile to open those identifications in Analytics.

 ## Users
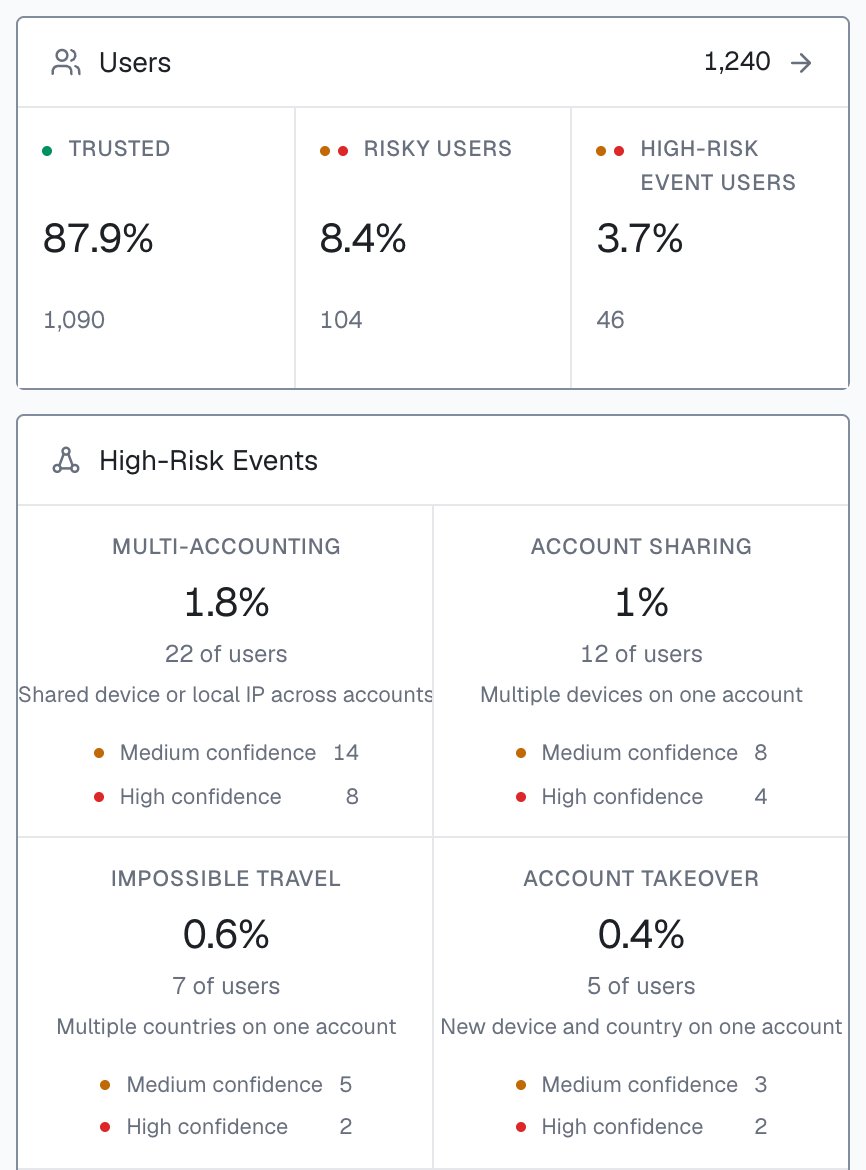
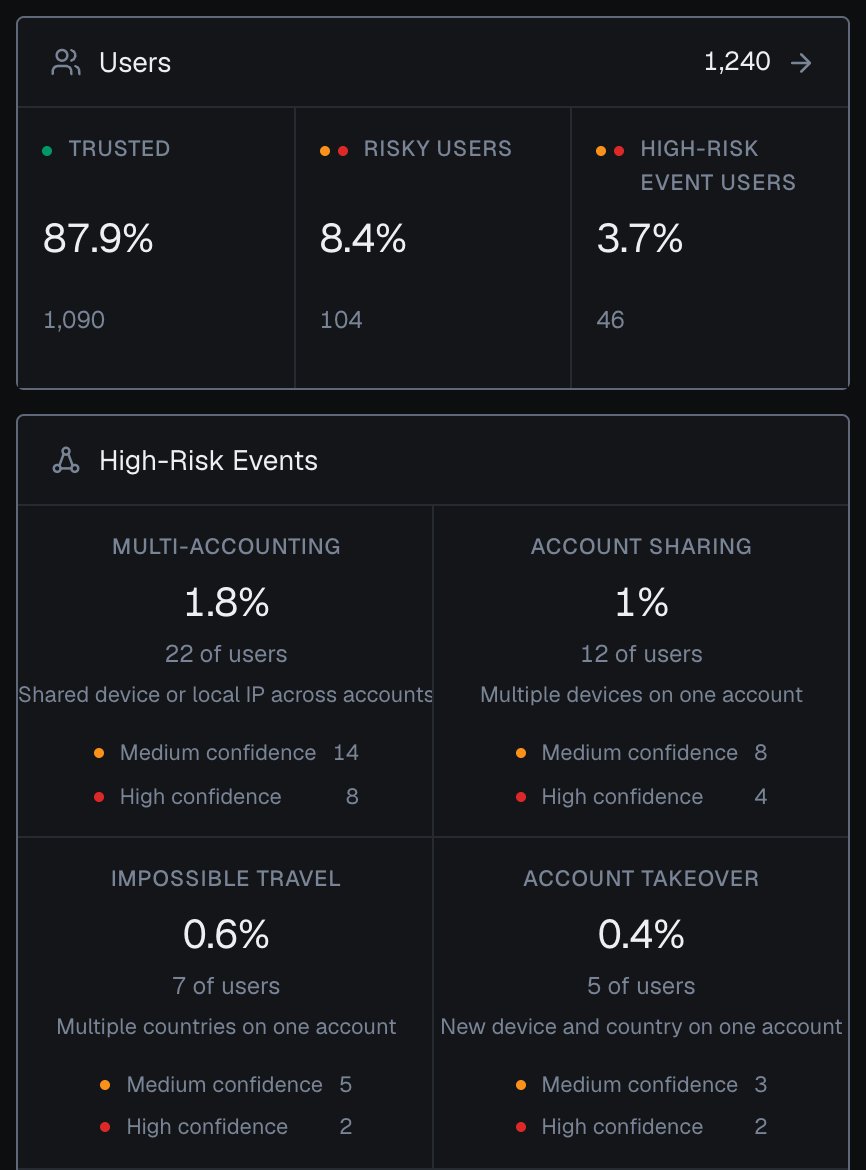
The **Users** panel counts the accounts active in the period, keyed by the hashed User HID you pass with `checkAuthenticatedUser`, in three groups that do not overlap:
* **Trusted**: every identification of the user in the period is Trusted, and the user has no High-Risk Event.
* **Risky users**: the user's worst band in the period is Suspicious or Dangerous, and the user has no High-Risk Event.
* **High-Risk Event users**: the user has at least one High-Risk Event, whatever its band.
The arrow next to the users total opens the Users tab of [Analytics](/dashboard/analytics), where every user opens its [card](/dashboard/entity-card).
## Users
The **Users** panel counts the accounts active in the period, keyed by the hashed User HID you pass with `checkAuthenticatedUser`, in three groups that do not overlap:
* **Trusted**: every identification of the user in the period is Trusted, and the user has no High-Risk Event.
* **Risky users**: the user's worst band in the period is Suspicious or Dangerous, and the user has no High-Risk Event.
* **High-Risk Event users**: the user has at least one High-Risk Event, whatever its band.
The arrow next to the users total opens the Users tab of [Analytics](/dashboard/analytics), where every user opens its [card](/dashboard/entity-card).
 ## High-Risk Events
Four tiles, one per event, always in this order: [Multi-accounting](/features/high-risk-events#multi-accounting), [Account sharing](/features/high-risk-events#account-sharing), [Impossible travel](/features/high-risk-events#impossible-travel) and [Account takeover](/features/high-risk-events#account-takeover). Each tile shows the share of users with the event, the number of those users, and how many of them sit at **Medium confidence** and at **High confidence**. Shares and counts are counted for the users active in the selected period.
Confidence is a separate axis from the Risk Score and the band: a user can be Trusted on every identification and still have a Multi-accounting event. The line under the panel shows when High-Risk Events were last updated. Select a tile to open the identifications of those users in Analytics, filtered to that event; switch to the **Users** tab to review the users themselves.
## Unique visitors
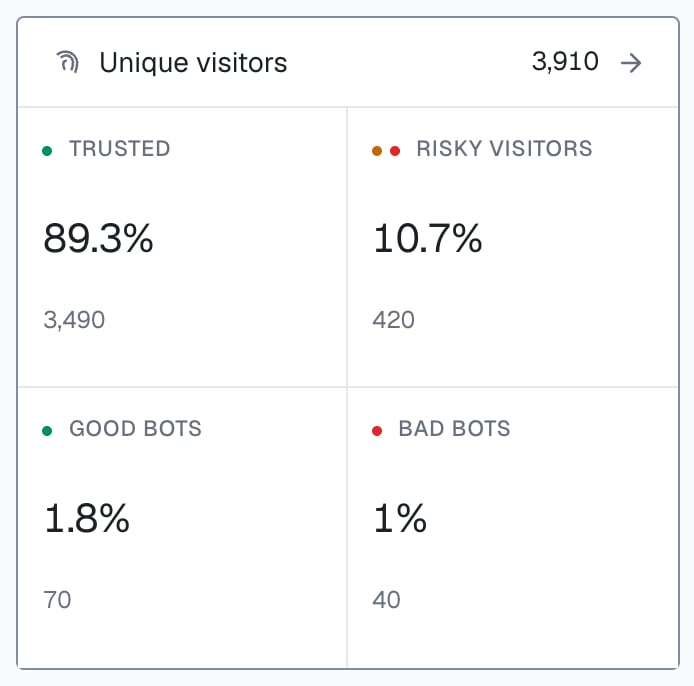
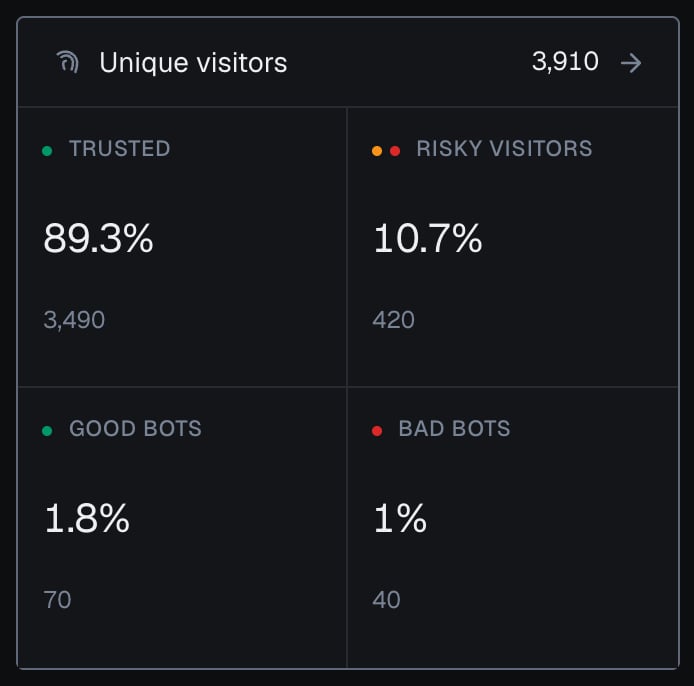
A visitor is one device plus one cookie, identified by its Visitor ID. **Trusted** and **Risky visitors** split all the period's visitors by their worst band, so the two add up to the panel's total:
* **Trusted**: the visitor's worst band in the period is Trusted.
* **Risky visitors**: the visitor's worst band in the period is Suspicious or Dangerous.
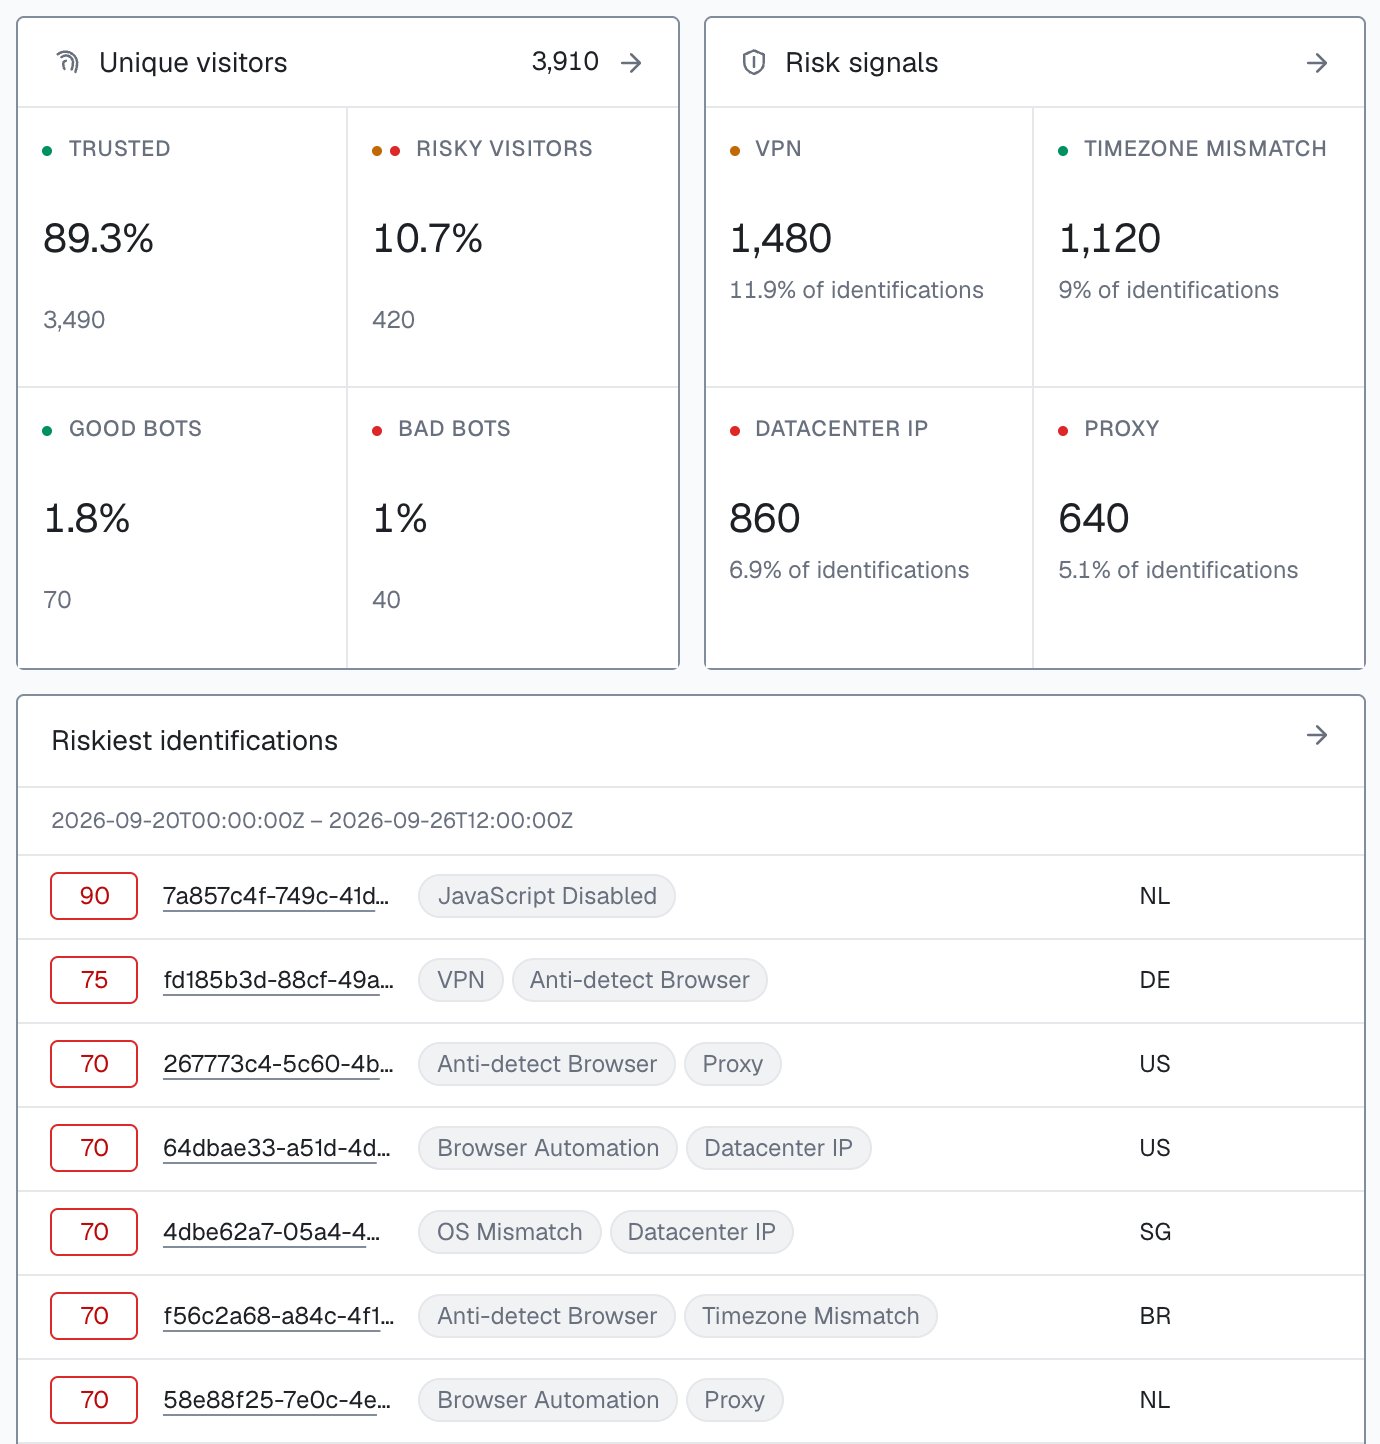
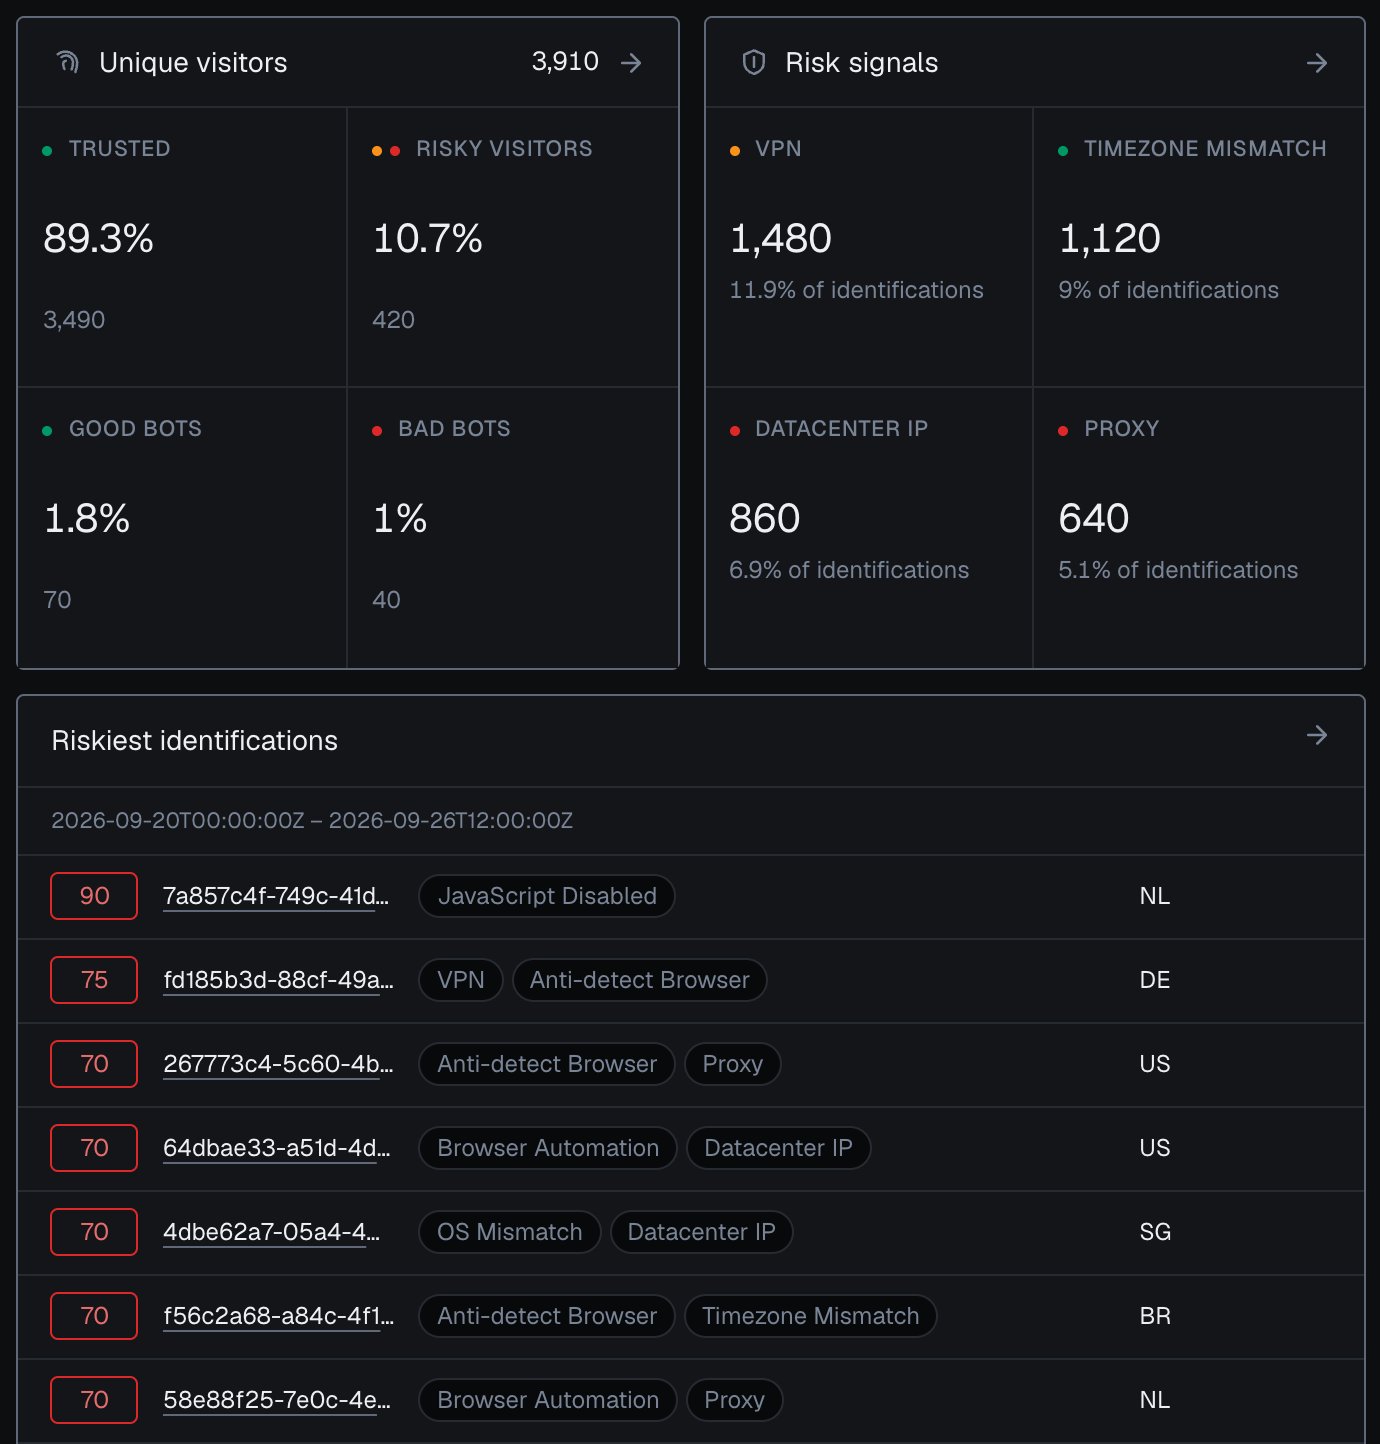
**Good bots** count the visitors among them identified as known search-engine crawlers, and **Bad bots** the visitors that fired Browser Automation, so a bot is also counted as Trusted or Risky. Bots are counted per visitor. Each tile opens the Unique visitors tab of Analytics with the matching filter, and [Bots and automation](/features/risk-signals#bots-and-automation) explains both.
## High-Risk Events
Four tiles, one per event, always in this order: [Multi-accounting](/features/high-risk-events#multi-accounting), [Account sharing](/features/high-risk-events#account-sharing), [Impossible travel](/features/high-risk-events#impossible-travel) and [Account takeover](/features/high-risk-events#account-takeover). Each tile shows the share of users with the event, the number of those users, and how many of them sit at **Medium confidence** and at **High confidence**. Shares and counts are counted for the users active in the selected period.
Confidence is a separate axis from the Risk Score and the band: a user can be Trusted on every identification and still have a Multi-accounting event. The line under the panel shows when High-Risk Events were last updated. Select a tile to open the identifications of those users in Analytics, filtered to that event; switch to the **Users** tab to review the users themselves.
## Unique visitors
A visitor is one device plus one cookie, identified by its Visitor ID. **Trusted** and **Risky visitors** split all the period's visitors by their worst band, so the two add up to the panel's total:
* **Trusted**: the visitor's worst band in the period is Trusted.
* **Risky visitors**: the visitor's worst band in the period is Suspicious or Dangerous.
**Good bots** count the visitors among them identified as known search-engine crawlers, and **Bad bots** the visitors that fired Browser Automation, so a bot is also counted as Trusted or Risky. Bots are counted per visitor. Each tile opens the Unique visitors tab of Analytics with the matching filter, and [Bots and automation](/features/risk-signals#bots-and-automation) explains both.
 ## Risk signals and riskiest identifications
**Risk signals** shows the four risk signals that fired on the largest share of the period's identifications, each with its share and count. The arrow opens the full list with each signal's **Weight**, **Share** and **Identifications**. One identification can fire several risk signals, so the shares do not add up to 100%. Select a signal to open its identifications in Analytics.
**Riskiest identifications** lists the highest Risk Scores of the period, each with its request ID, its top risk signals and its country. Select a row to open its [identification card](/dashboard/identification-card); the arrow opens the Dangerous band in Analytics.
## Risk signals and riskiest identifications
**Risk signals** shows the four risk signals that fired on the largest share of the period's identifications, each with its share and count. The arrow opens the full list with each signal's **Weight**, **Share** and **Identifications**. One identification can fire several risk signals, so the shares do not add up to 100%. Select a signal to open its identifications in Analytics.
**Riskiest identifications** lists the highest Risk Scores of the period, each with its request ID, its top risk signals and its country. Select a row to open its [identification card](/dashboard/identification-card); the arrow opens the Dangerous band in Analytics.
 ## Top lists
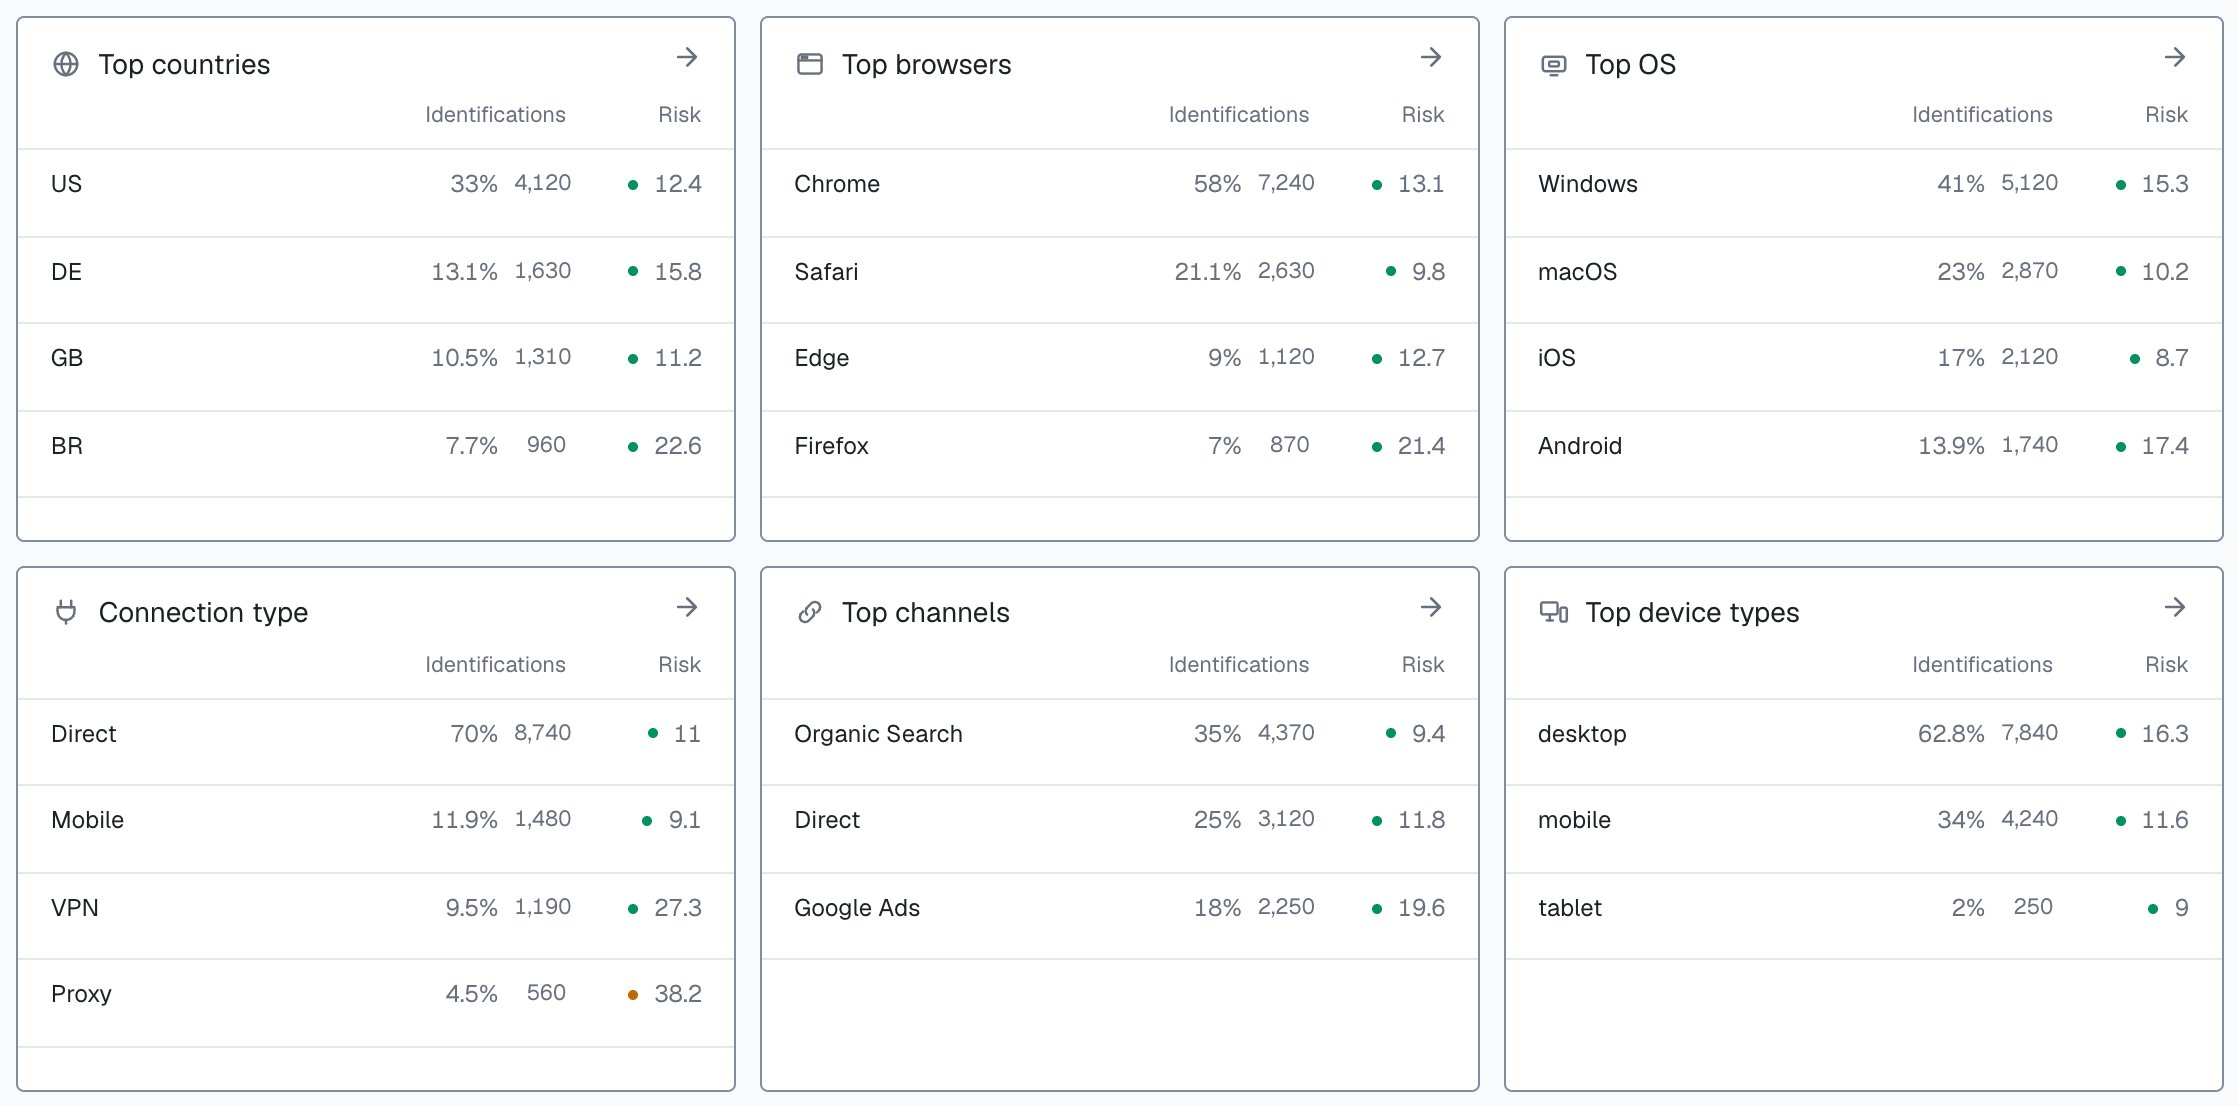
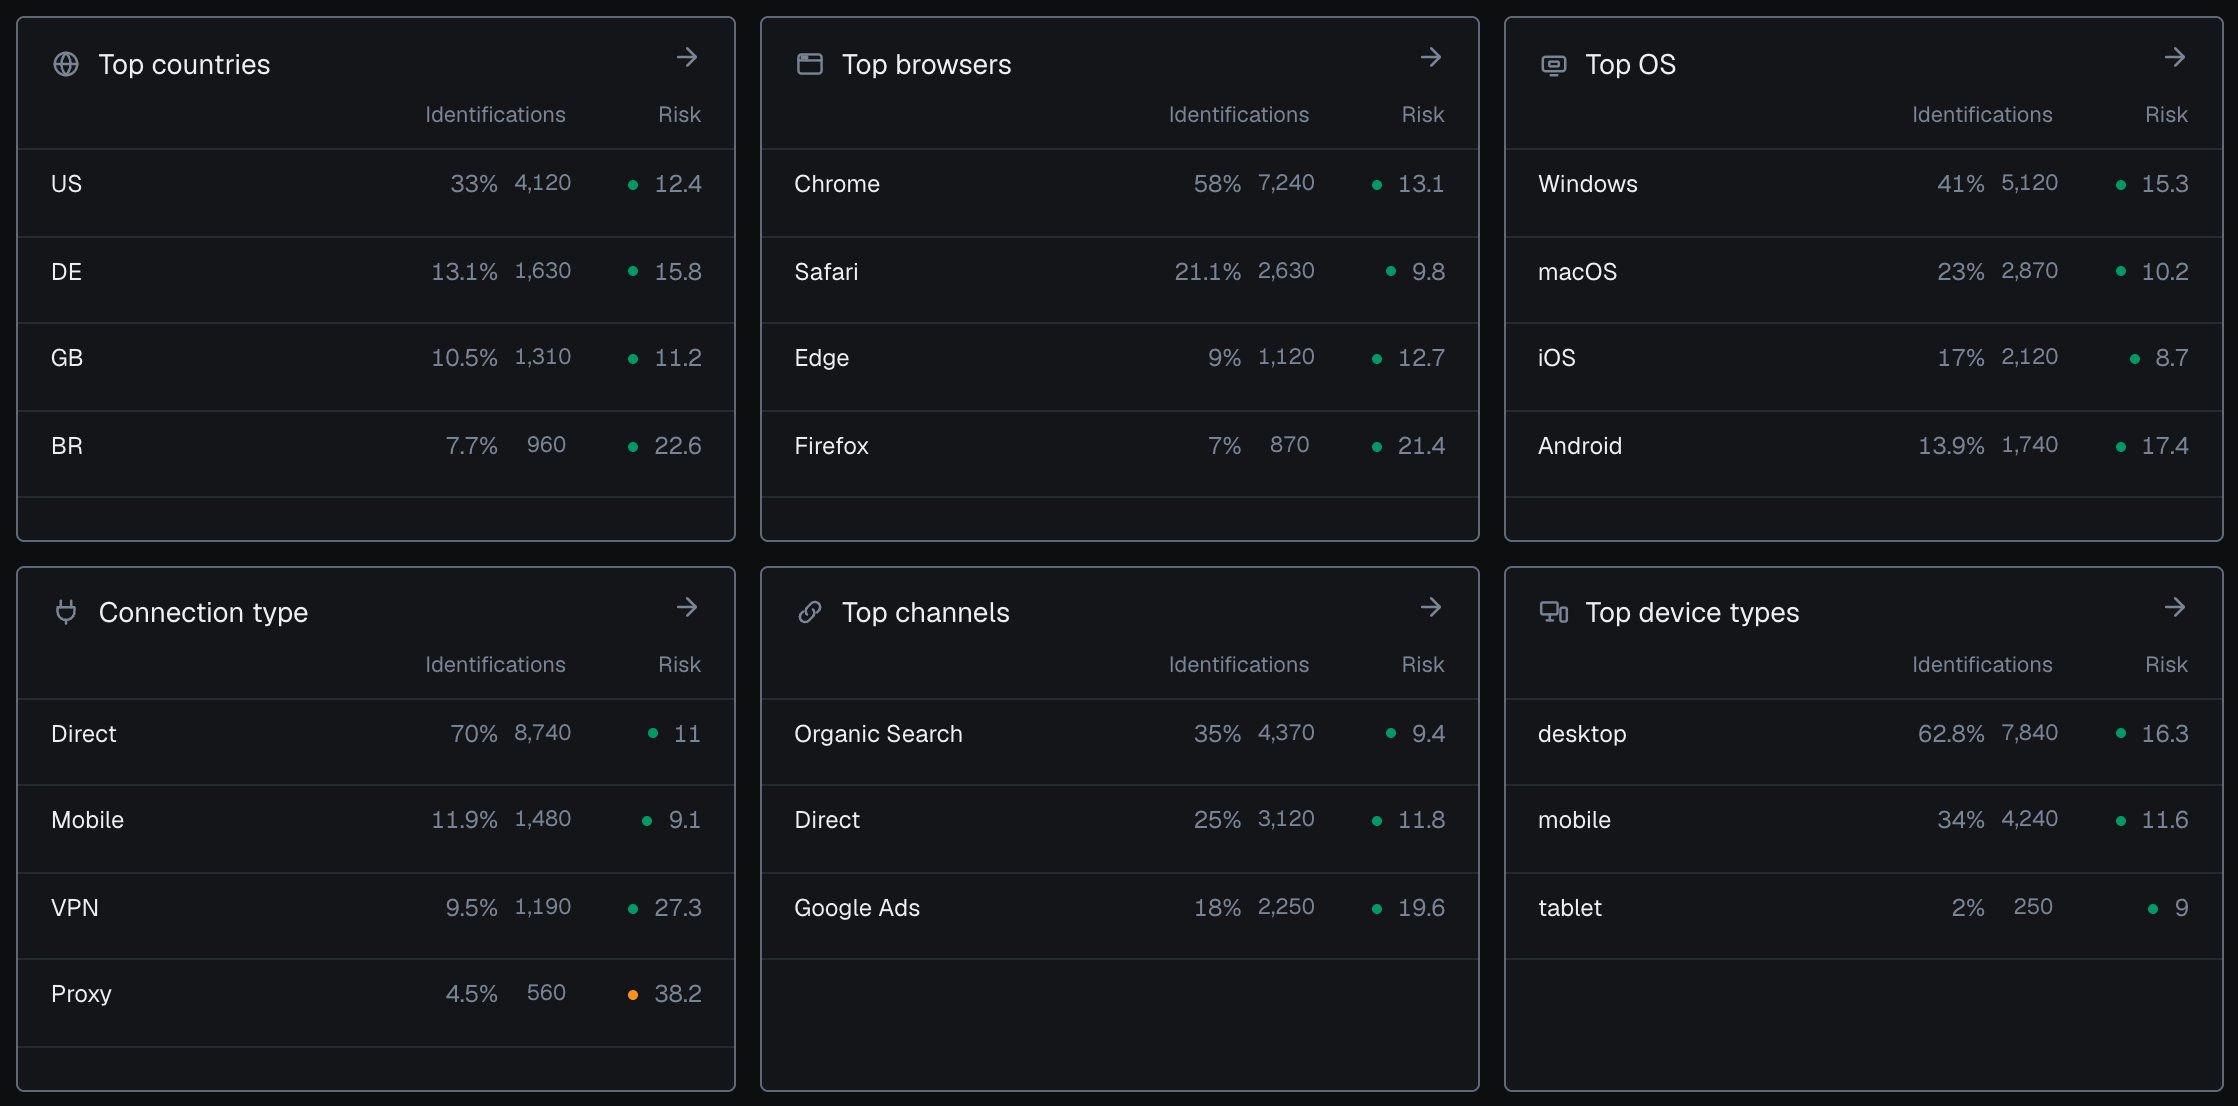
Six lists show where the period's identifications came from: **Top countries**, **Top browsers**, **Top OS**, **Connection type**, **Top channels** and **Top device types**. Each row carries its **Identifications** and its **Risk**, the average Risk Score of those identifications. The arrow in a list's header opens the full list with **Value**, **Share**, **Identifications** and **Risk**, and each row opens Analytics filtered to that value. The channel values are listed on [Traffic Analytics](/features/traffic-analytics).
## Top lists
Six lists show where the period's identifications came from: **Top countries**, **Top browsers**, **Top OS**, **Connection type**, **Top channels** and **Top device types**. Each row carries its **Identifications** and its **Risk**, the average Risk Score of those identifications. The arrow in a list's header opens the full list with **Value**, **Share**, **Identifications** and **Risk**, and each row opens Analytics filtered to that value. The channel values are listed on [Traffic Analytics](/features/traffic-analytics).
 ## Empty states
* **Before the first identification.** The panels stay empty until the snippet reports. Open [Integration](/dashboard/integration) and check that your domain shows **Reporting**.
* **No User HID in the selection.** The Users and High-Risk Events panels say that the selection has no hashed User HID, and the rest of the screen works as usual. Pass a hashed User HID with `checkAuthenticatedUser` on every signed-in page. Users, account-level risk and all four High-Risk Events are built on it. See [Identify signed-in users](/setup/snippet#identify-signed-in-users).
* **Nothing in the period.** Pick a longer period or another domain.
## Reading the analytics dashboard is free
Opening any screen, filtering and exporting use none of your included identifications. Your plan counts identifications only.
## Next steps
Find the users, devices, visitors and IPs behind any tile and filter them.
One account with its band, its High-Risk Events and everything linked to it.
Why one identification scored what it did.
Ask about your traffic and open the evidence behind each answer.
Snippet, domains, API keys and webhook endpoints.
Identifications used this billing cycle, and your plan.
The five identities behind every tile, and how they link.
The four events detected on your users, at Medium or High confidence.
Every risk signal with its weight.
## Empty states
* **Before the first identification.** The panels stay empty until the snippet reports. Open [Integration](/dashboard/integration) and check that your domain shows **Reporting**.
* **No User HID in the selection.** The Users and High-Risk Events panels say that the selection has no hashed User HID, and the rest of the screen works as usual. Pass a hashed User HID with `checkAuthenticatedUser` on every signed-in page. Users, account-level risk and all four High-Risk Events are built on it. See [Identify signed-in users](/setup/snippet#identify-signed-in-users).
* **Nothing in the period.** Pick a longer period or another domain.
## Reading the analytics dashboard is free
Opening any screen, filtering and exporting use none of your included identifications. Your plan counts identifications only.
## Next steps
Find the users, devices, visitors and IPs behind any tile and filter them.
One account with its band, its High-Risk Events and everything linked to it.
Why one identification scored what it did.
Ask about your traffic and open the evidence behind each answer.
Snippet, domains, API keys and webhook endpoints.
Identifications used this billing cycle, and your plan.
The five identities behind every tile, and how they link.
The four events detected on your users, at Medium or High confidence.
Every risk signal with its weight.