> ## Documentation Index
> Fetch the complete documentation index at: https://docs.shieldlabs.ai/llms.txt
> Use this file to discover all available pages before exploring further.
# Analytics
> Find the users, devices, visitors and IP addresses behind your risky traffic, filter them and export the identifications.
This page describes the new analytics dashboard, which is rolling out to all accounts.
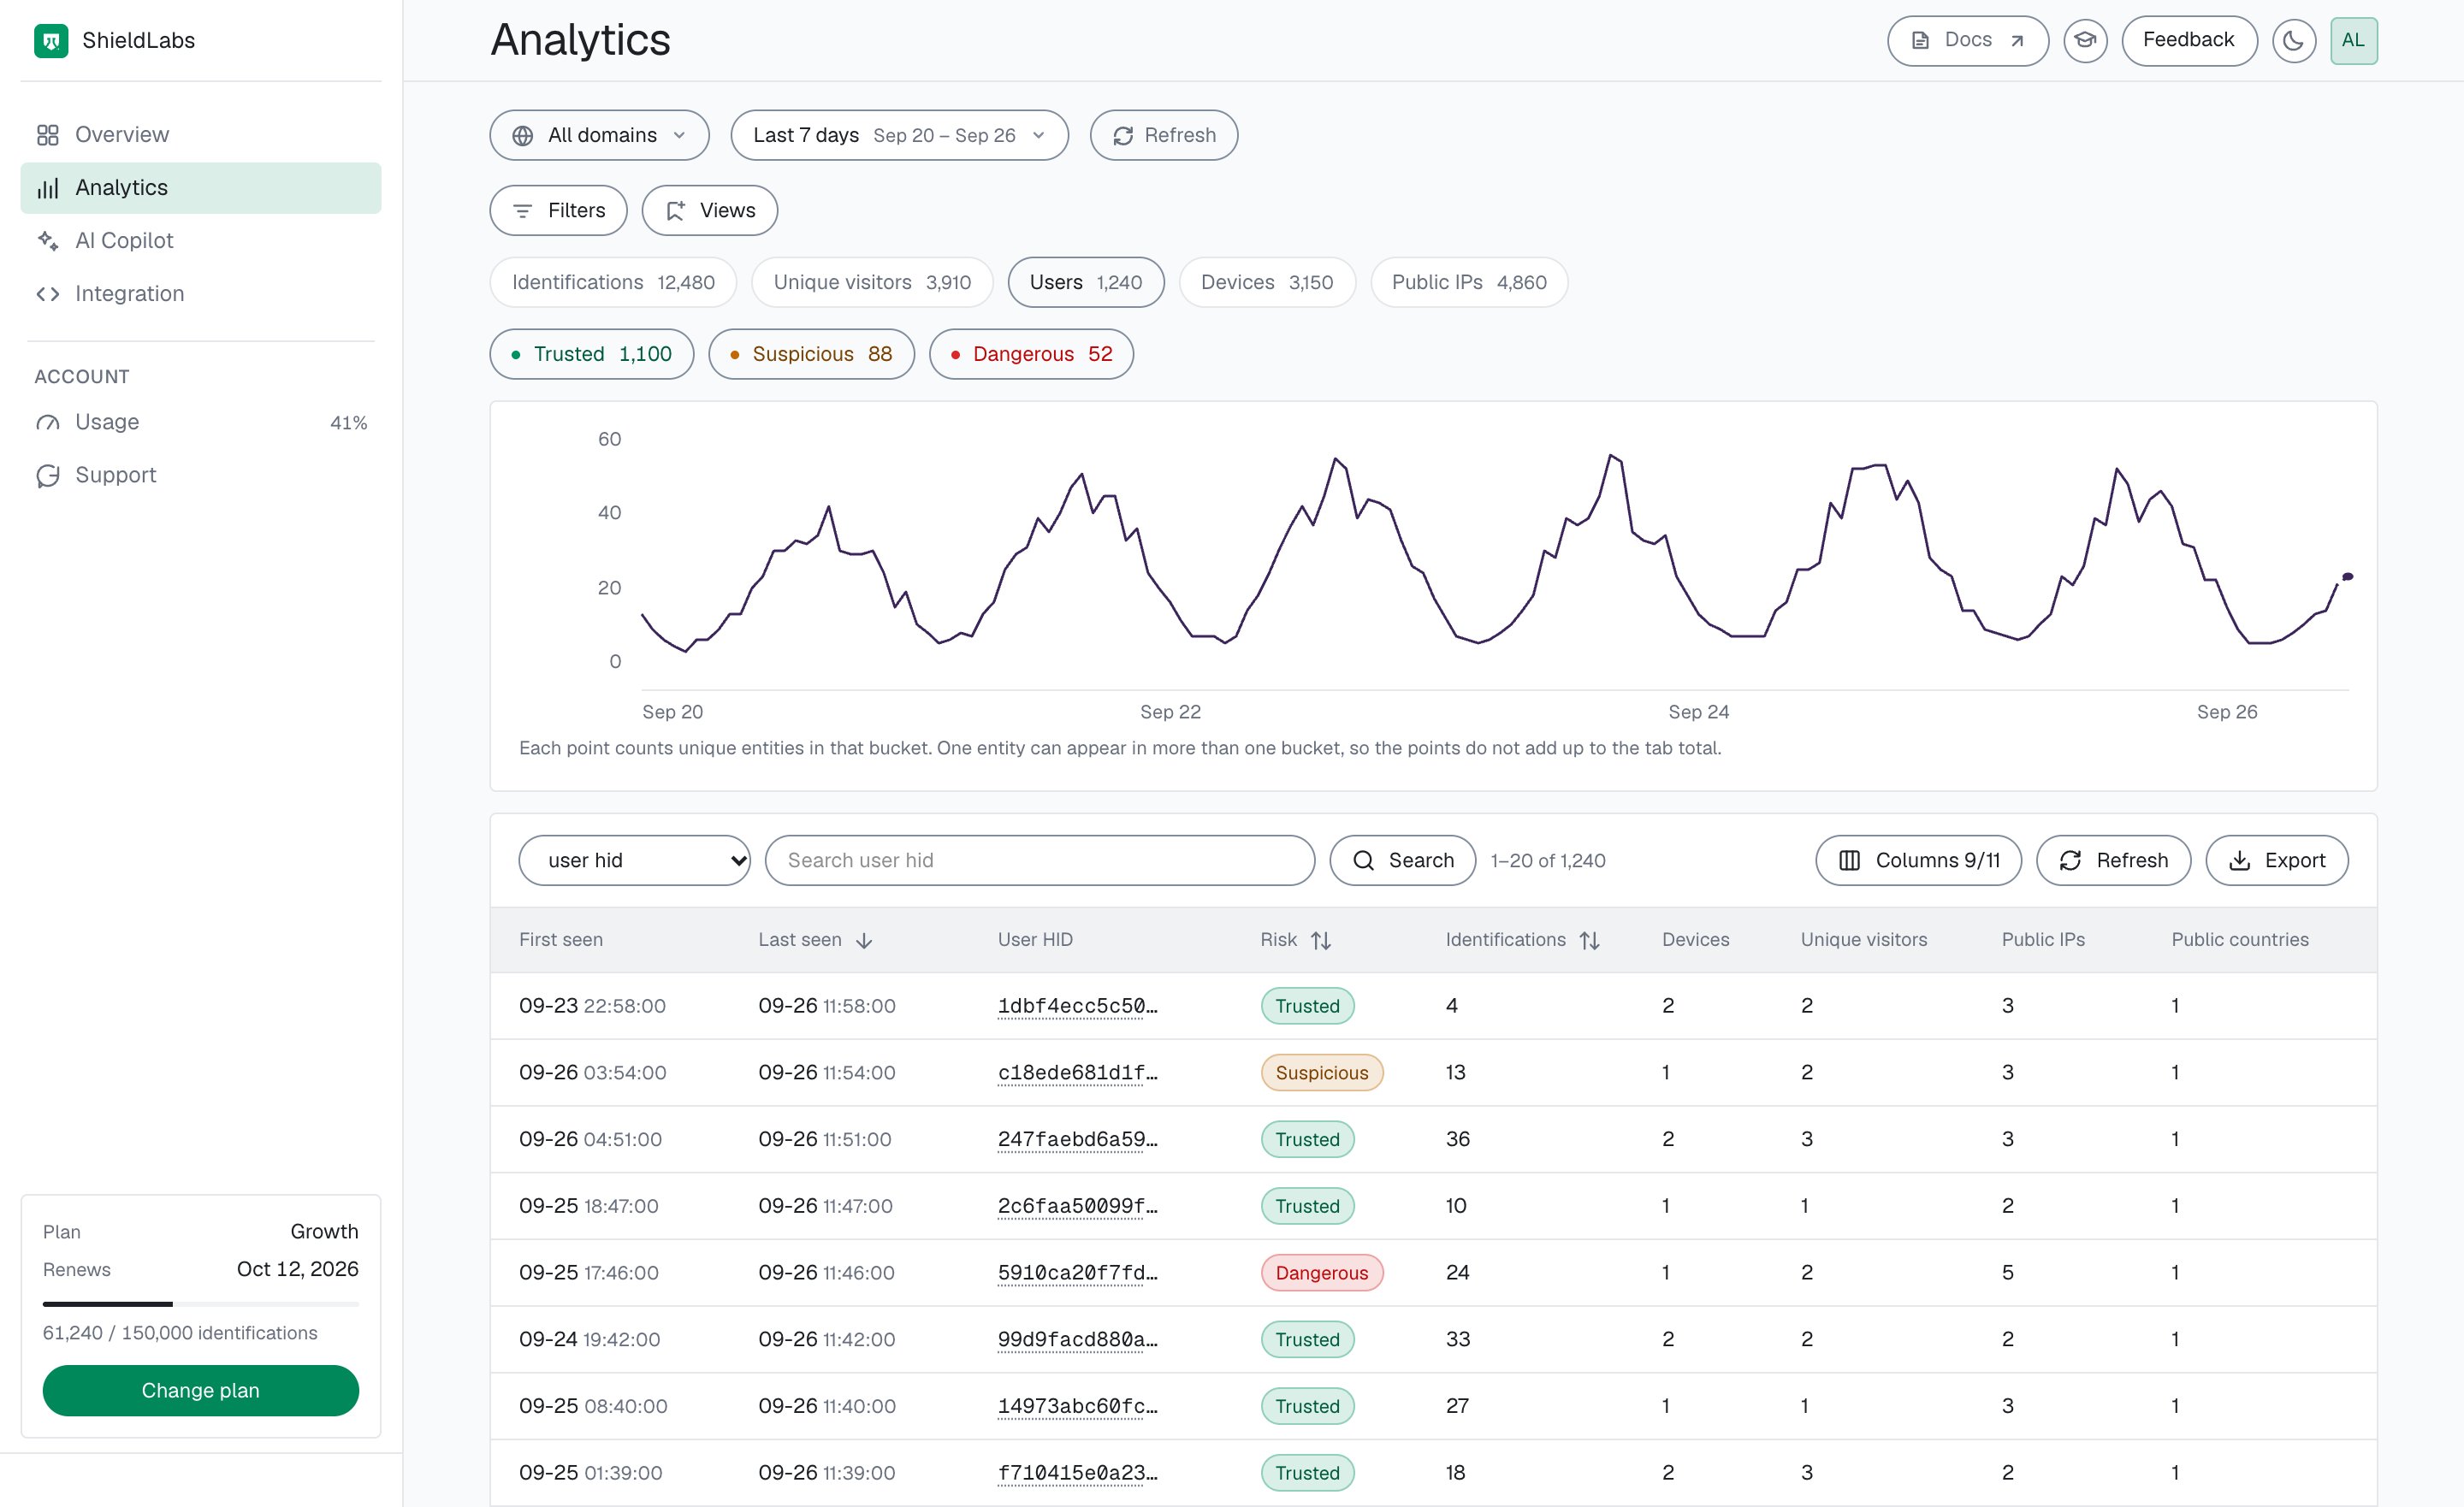
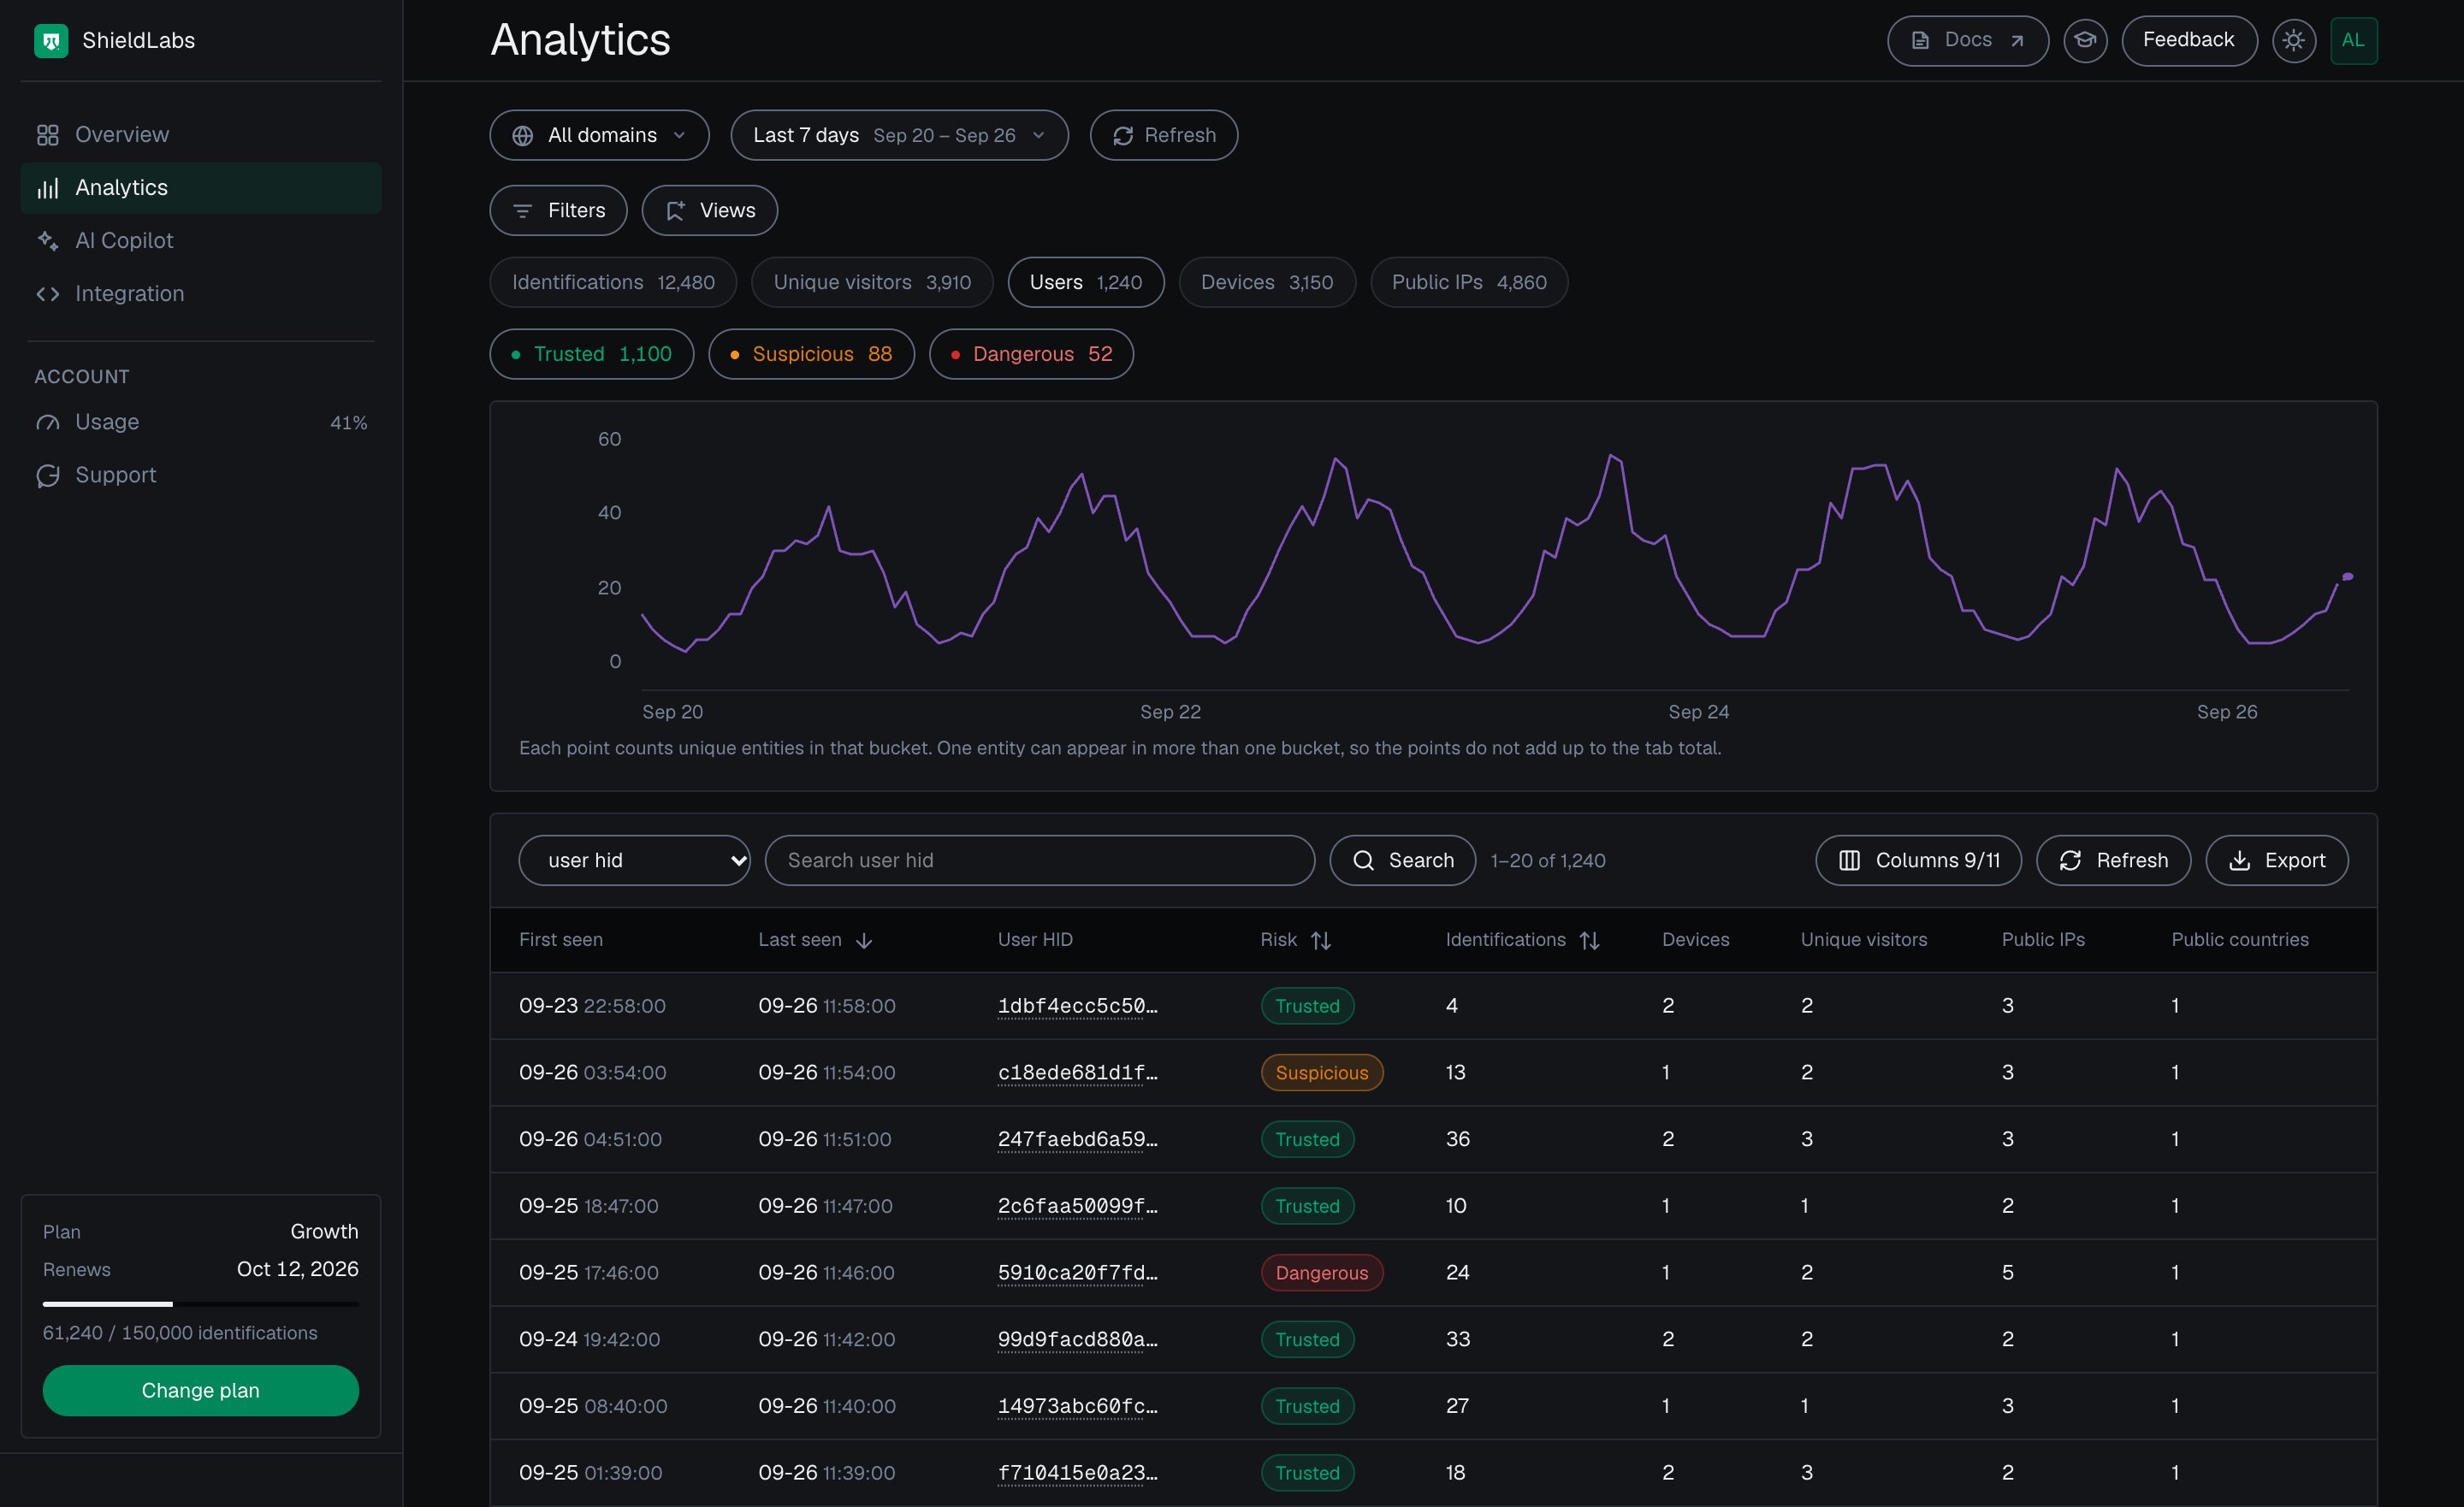
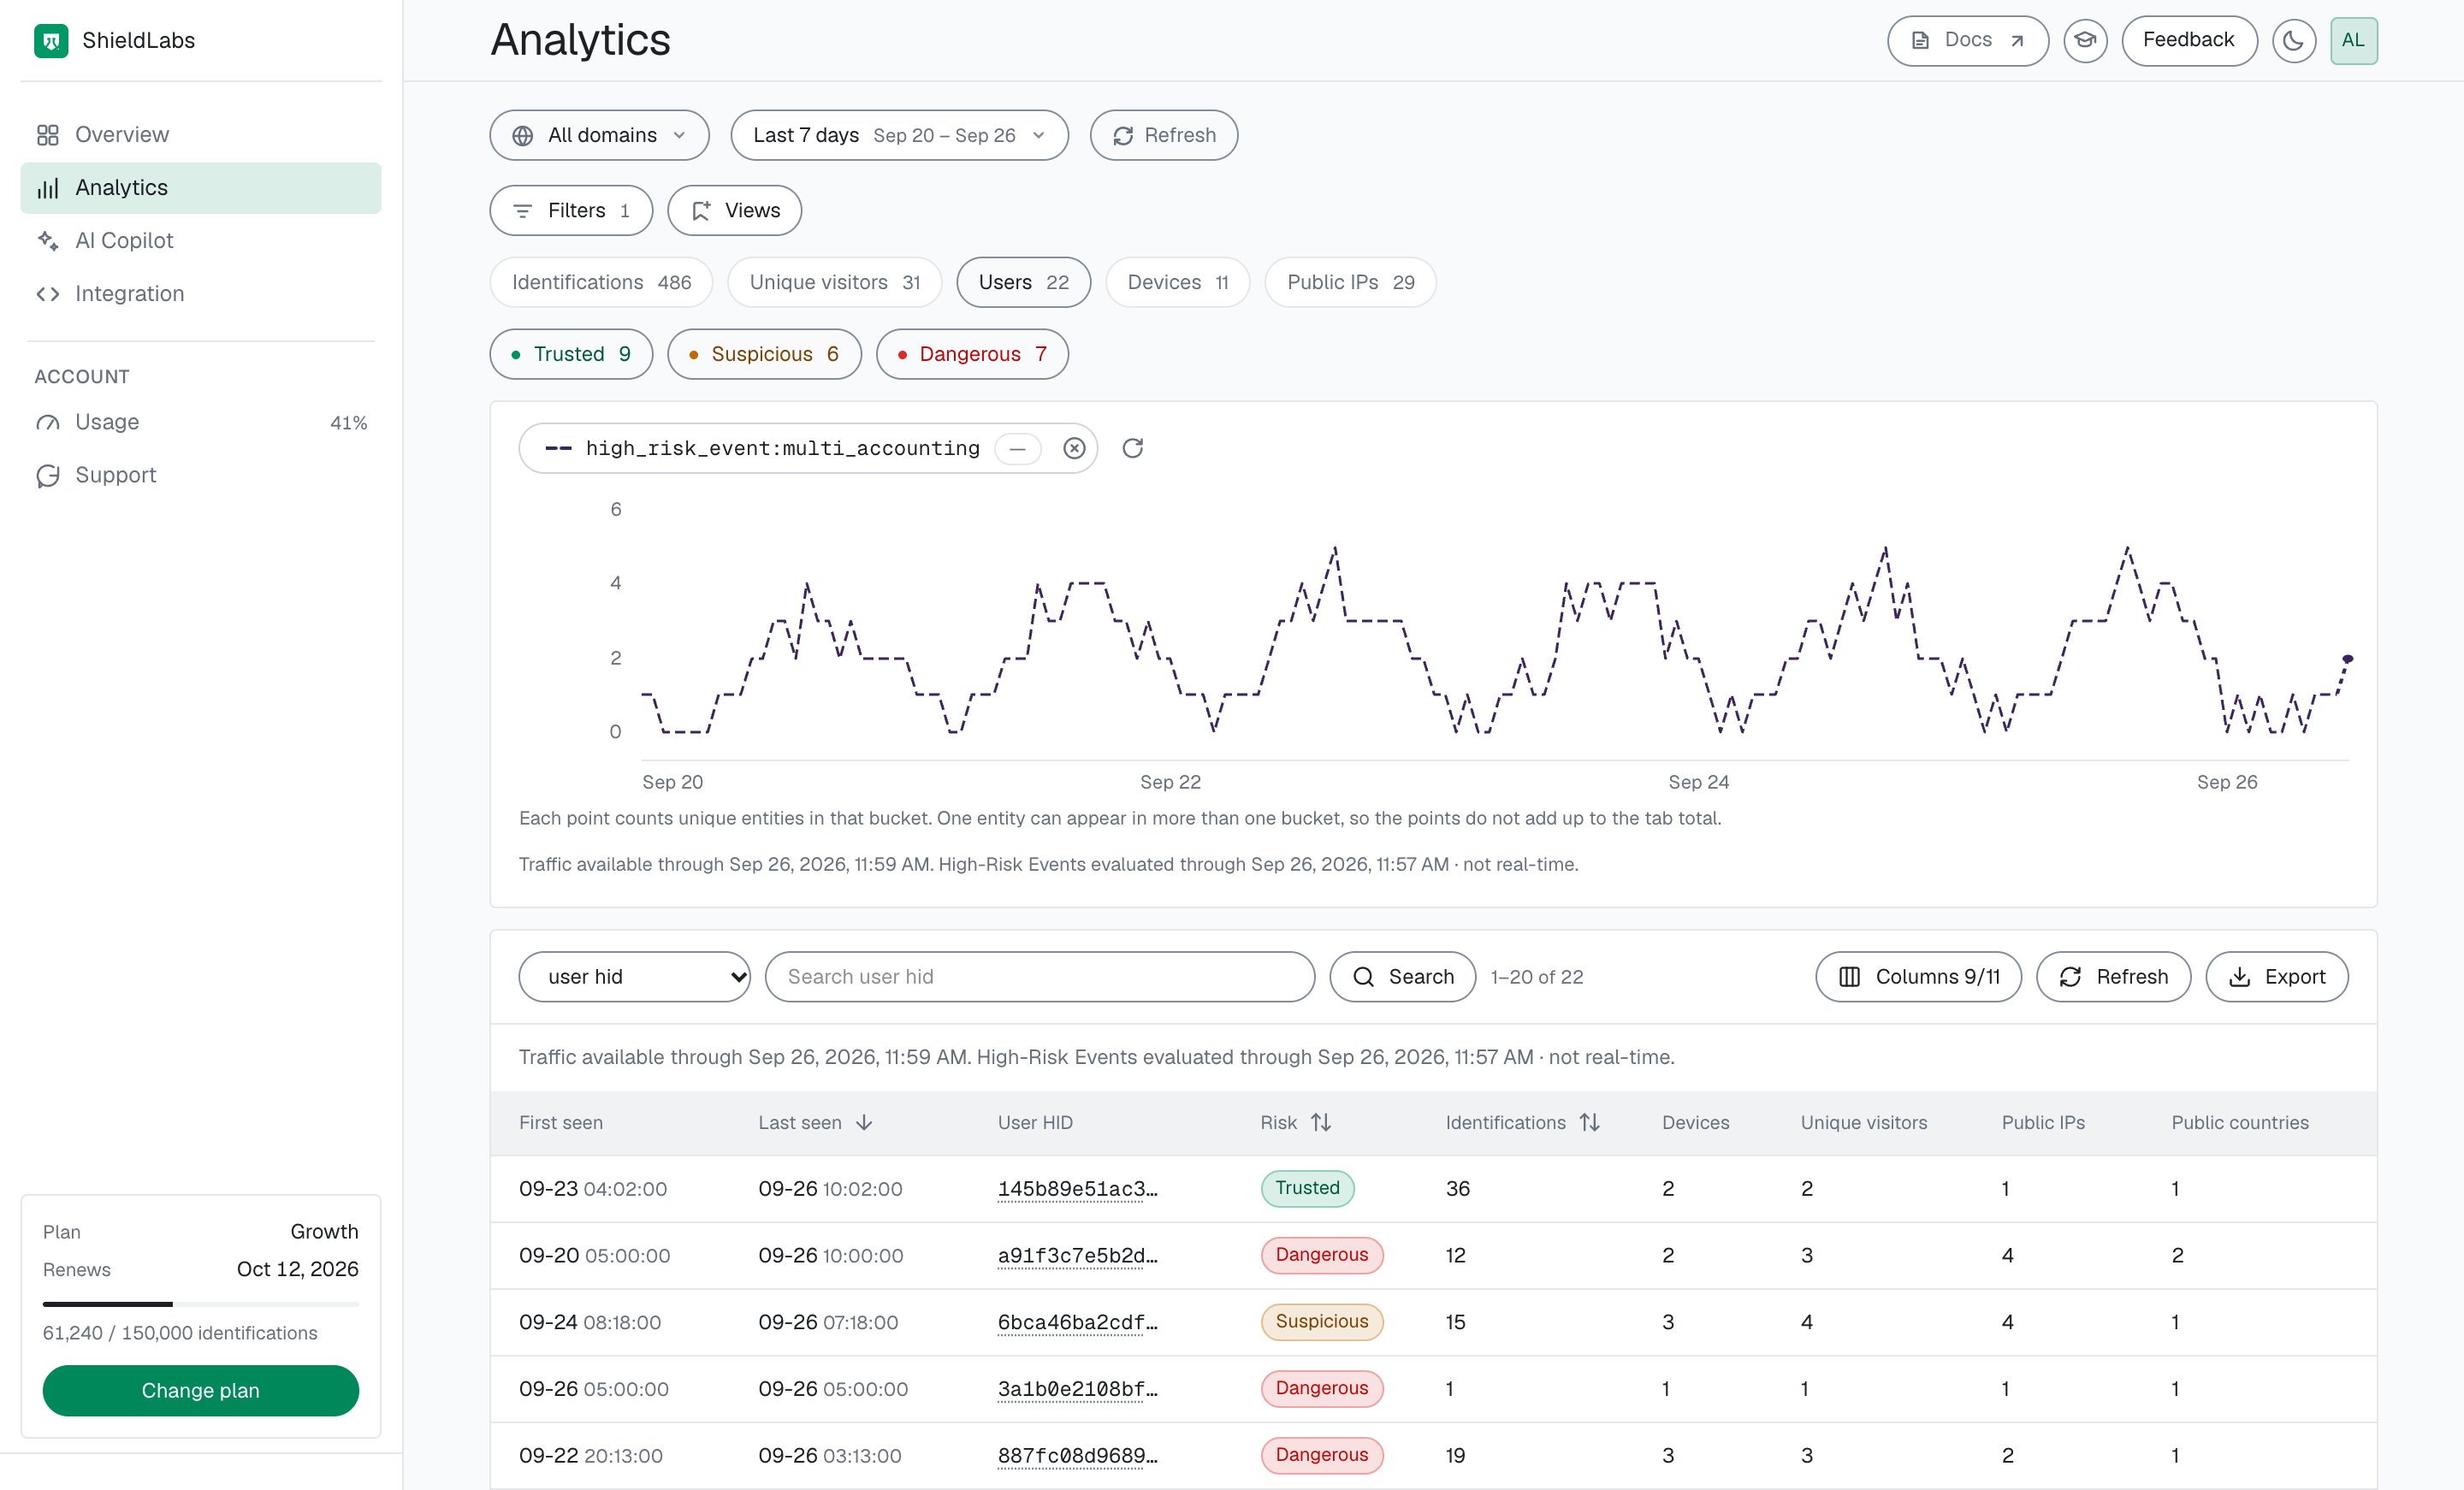
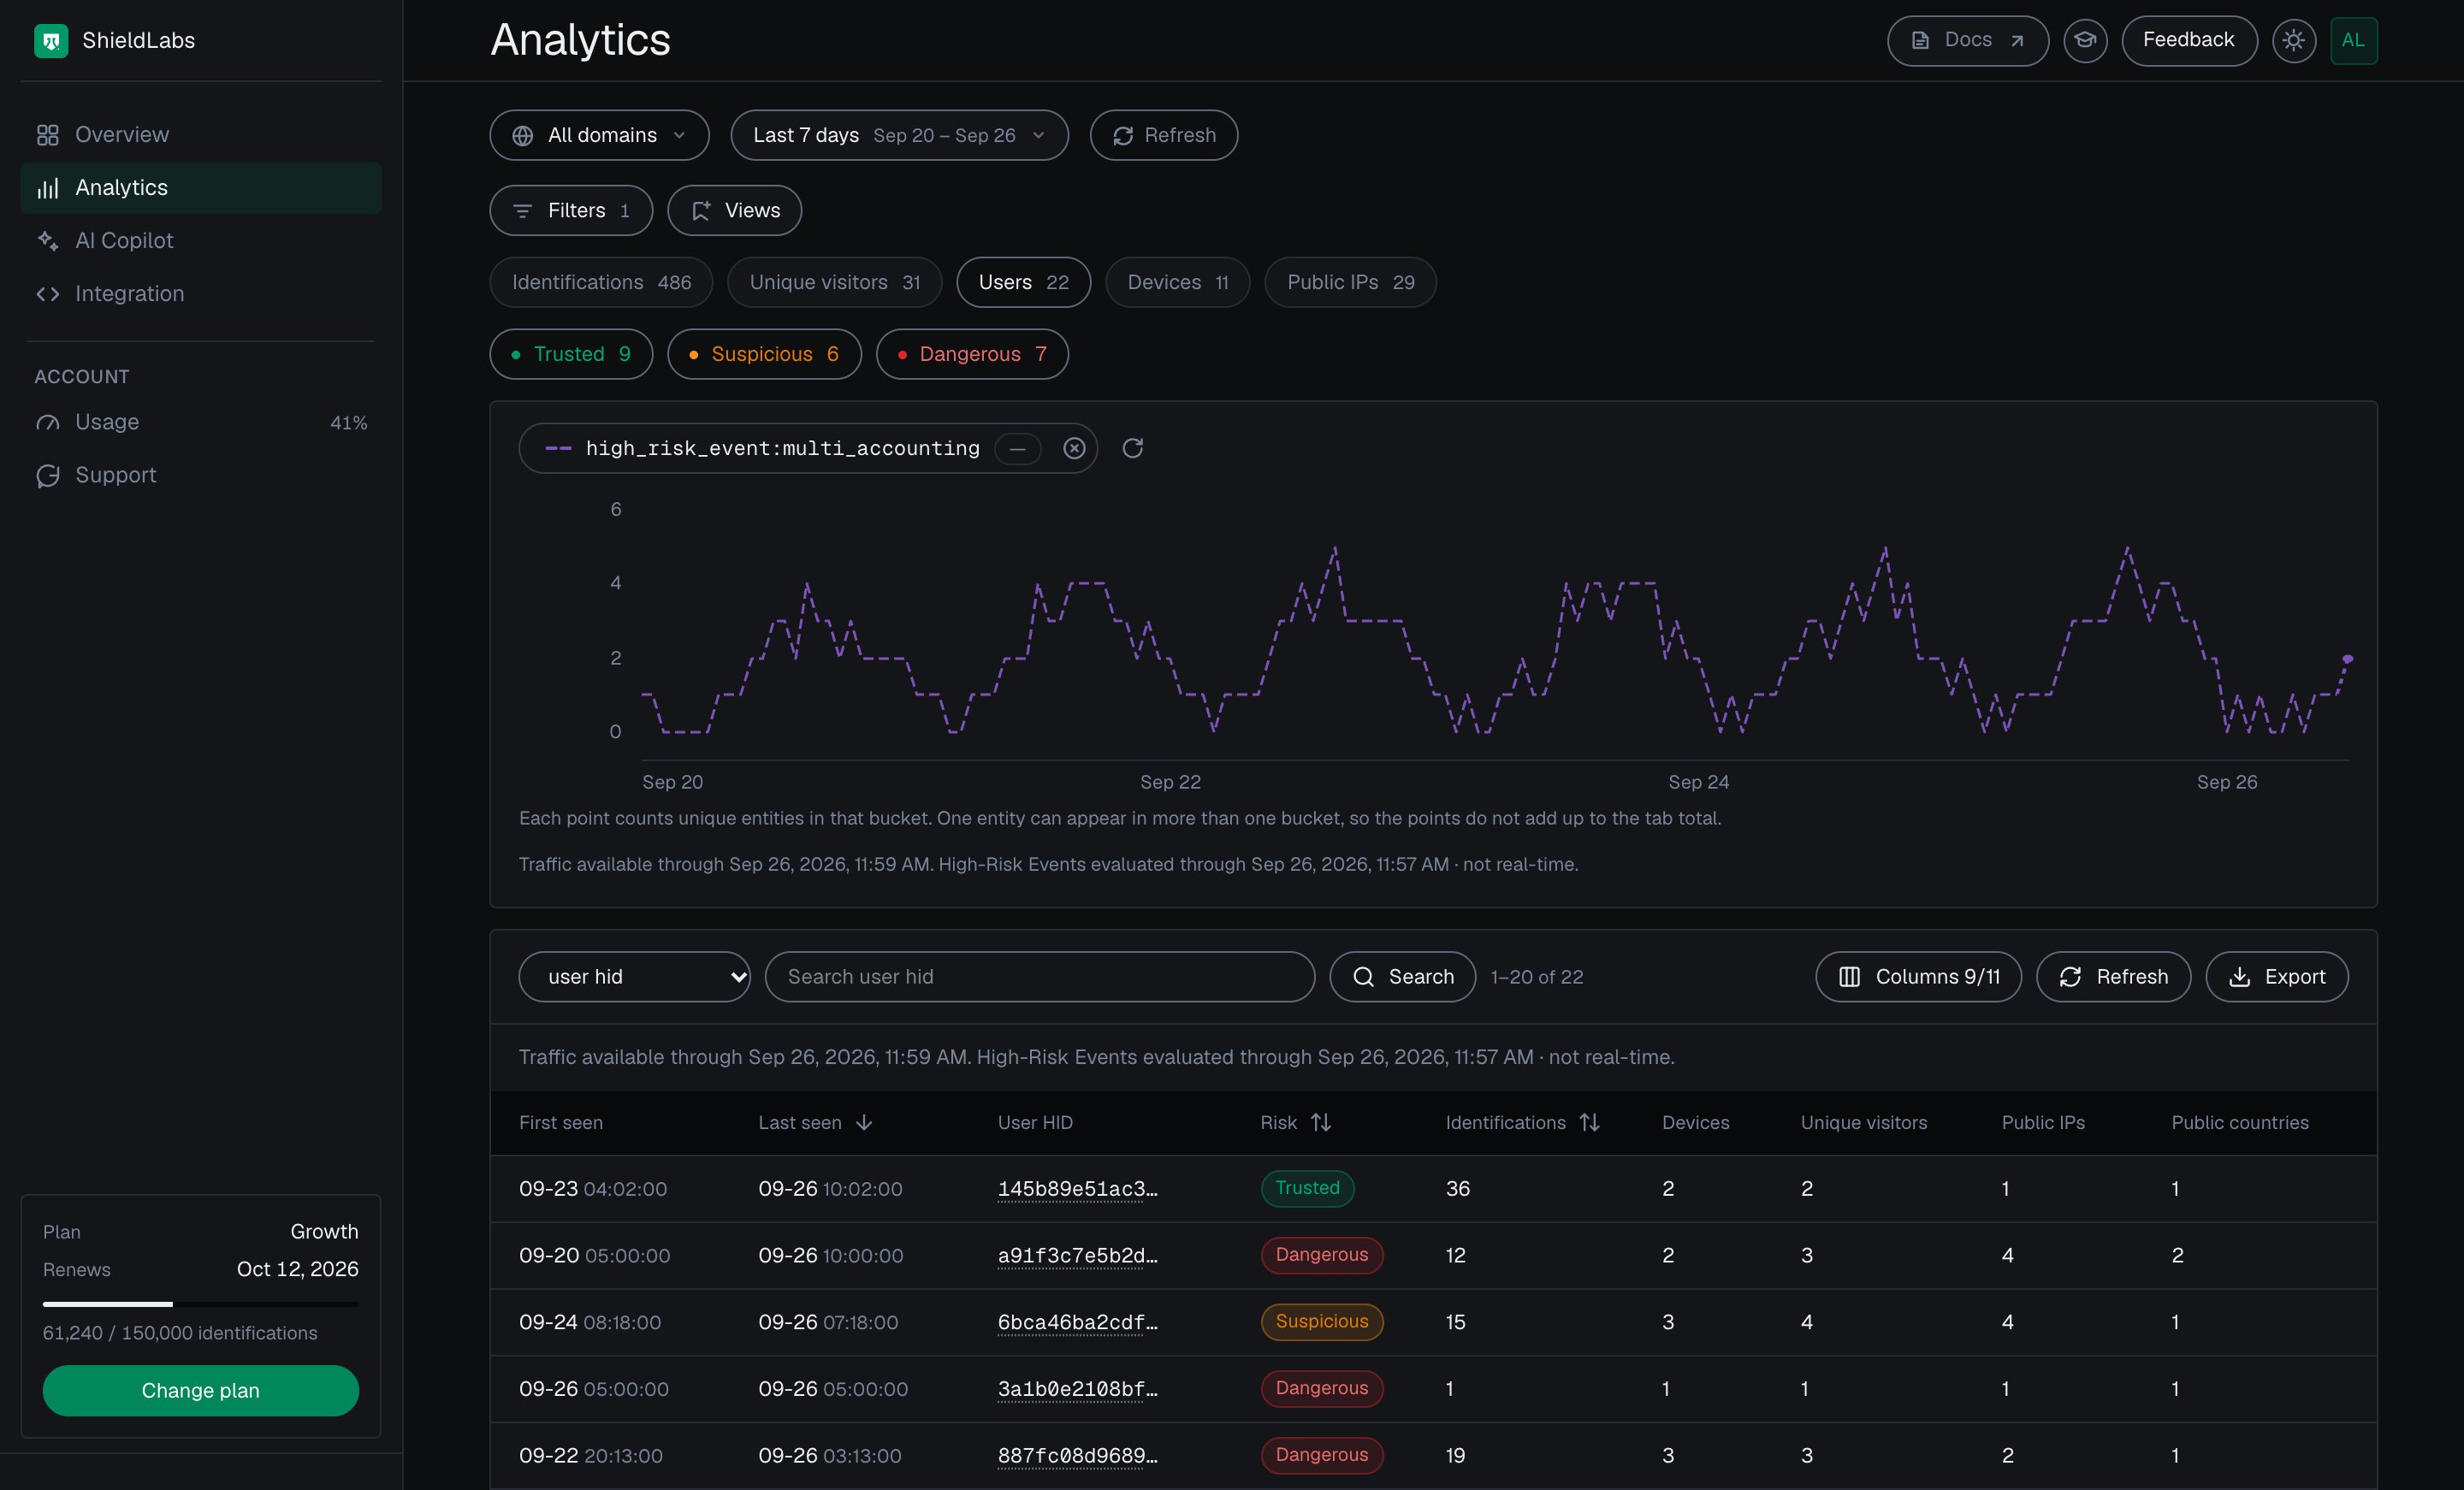
Analytics is the working table of the analytics dashboard. It lists your users, devices, visitors and public IPs with the band each one earned in the period, and every identification underneath them. Pick a tab, narrow it by band and filters, read the trend, and open any row. It answers three questions: which accounts are risky in this period and why, how risk moved over the period, and which filter isolates the abuse.
 ## Five tabs
On screen the tabs read Identifications, Unique visitors, Users, Devices and Public IPs, each with its count for the period. For account-level review, start on **Users**.
| Tab | One row per | Risk shown |
| ------------------- | ------------------------------------------------------------ | ------------------------ |
| **Users** | User HID, the account you pass with `checkAuthenticatedUser` | band |
| **Devices** | Device ID | band |
| **Unique visitors** | Visitor ID, one device plus one cookie | band |
| **Public IPs** | public IP address | band |
| **Identifications** | identification, one check by the snippet | its Risk Score, 0 to 100 |
A user, device, visitor or public IP carries the worst band of its identifications in the selected period; only an identification has a numeric Risk Score. Local IPs appear as the optional **Local IP** column of the Identifications tab (add it with **Columns**) and as linked local IPs on each card, with the identifications behind each. [Users, devices, visitors and IPs](/concepts/entities) explains how the identities link.
## Band filters
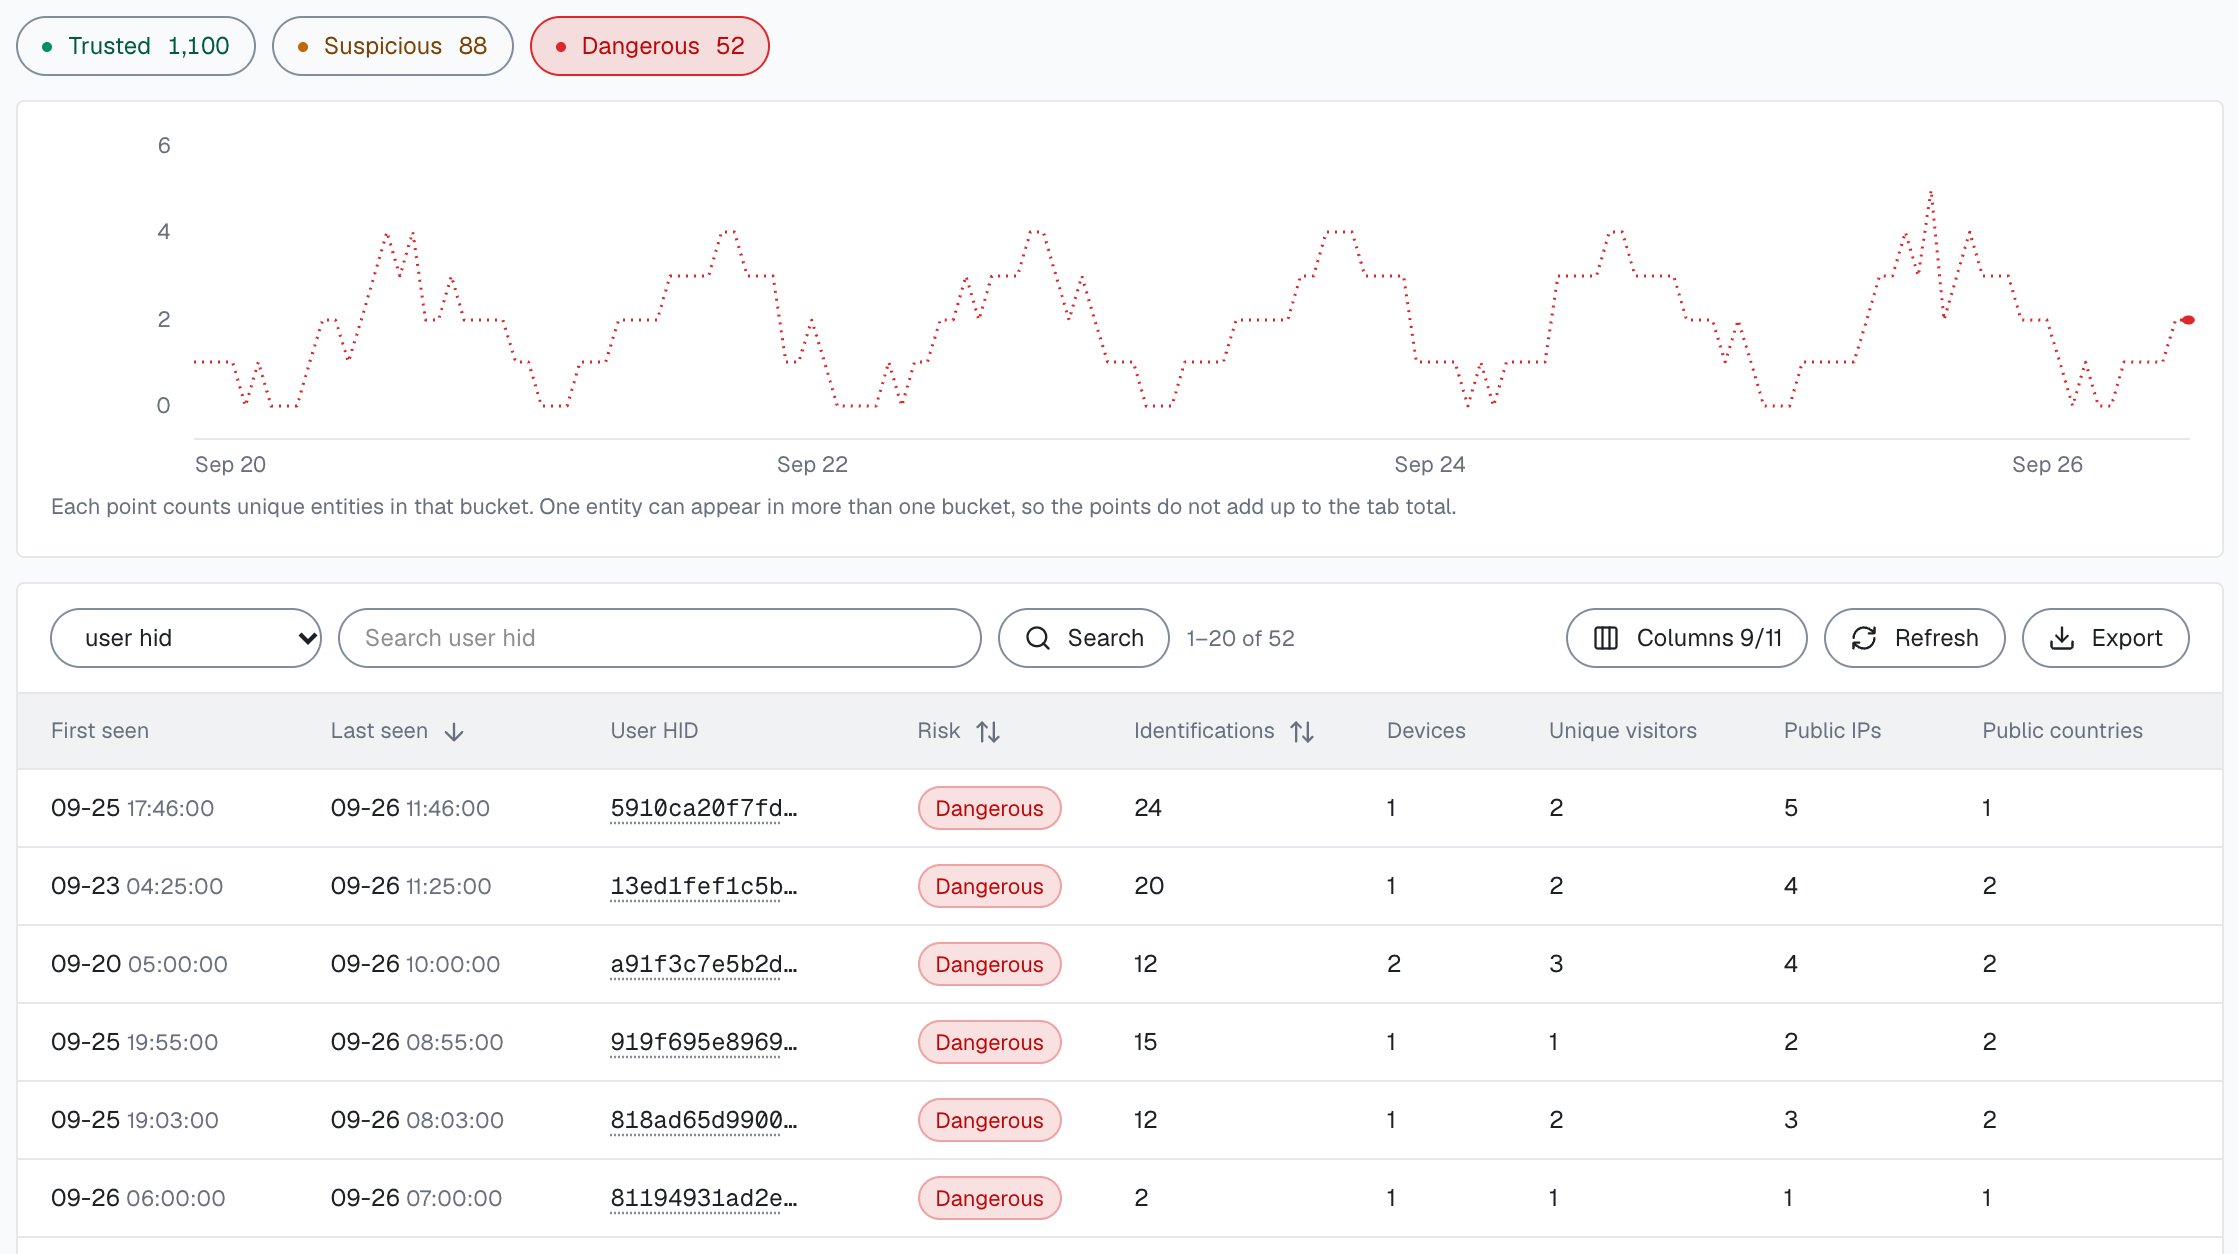
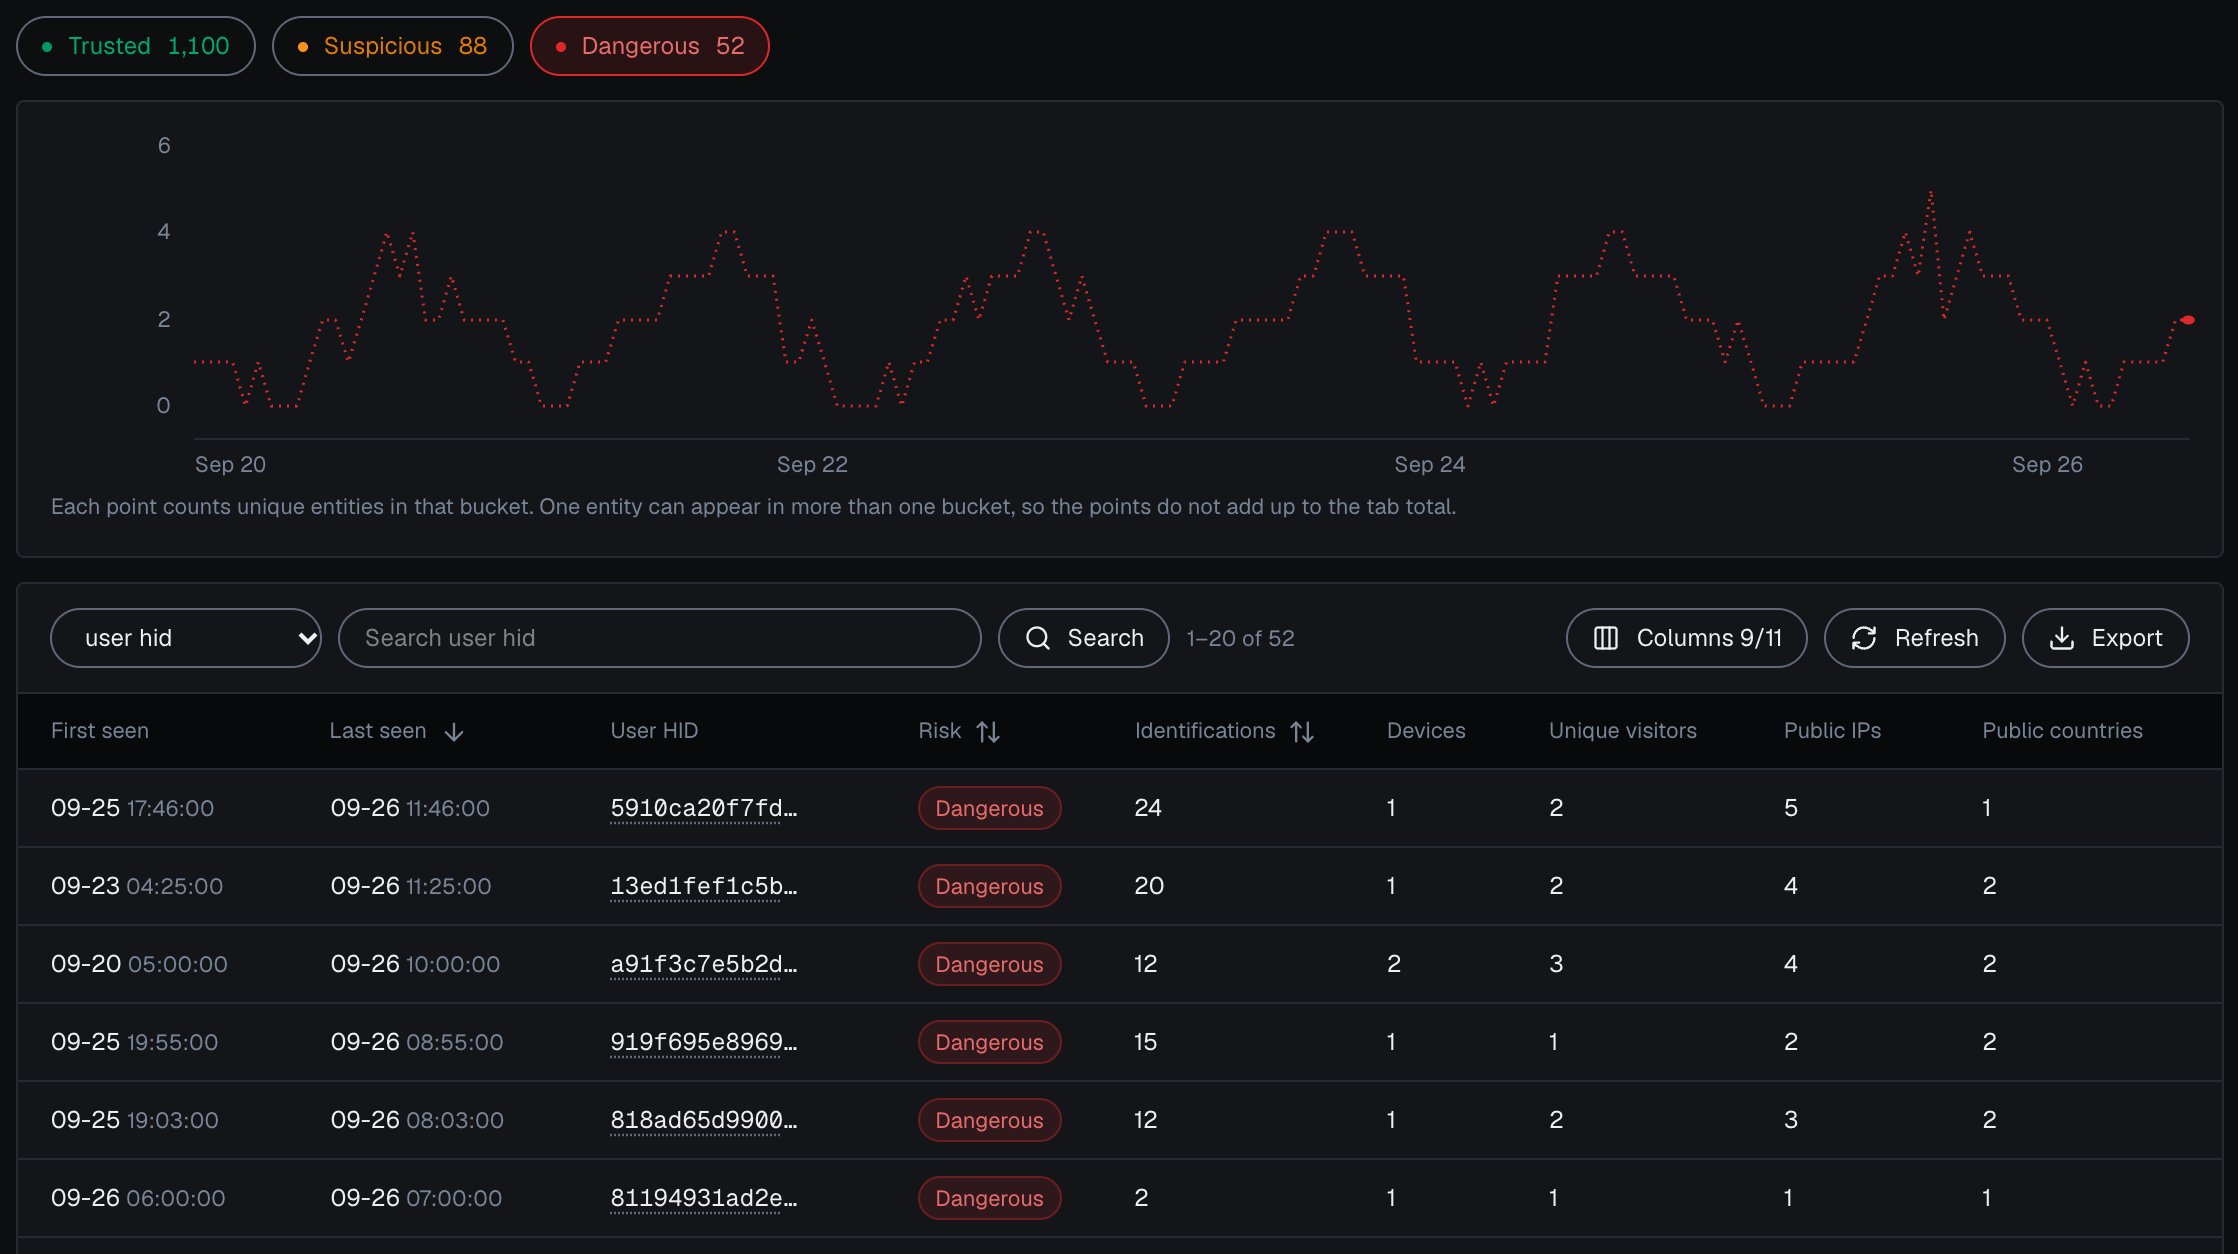
The pills **Trusted**, **Suspicious** and **Dangerous** show how many rows of the tab fall in each band. Select one or more to filter the table and the chart. On the Identifications tab they filter by each identification's own Risk Score. On an identity tab they filter by the worst band in the period, so **Dangerous** on the Users tab lists every user with at least one Dangerous identification in the period.
## Five tabs
On screen the tabs read Identifications, Unique visitors, Users, Devices and Public IPs, each with its count for the period. For account-level review, start on **Users**.
| Tab | One row per | Risk shown |
| ------------------- | ------------------------------------------------------------ | ------------------------ |
| **Users** | User HID, the account you pass with `checkAuthenticatedUser` | band |
| **Devices** | Device ID | band |
| **Unique visitors** | Visitor ID, one device plus one cookie | band |
| **Public IPs** | public IP address | band |
| **Identifications** | identification, one check by the snippet | its Risk Score, 0 to 100 |
A user, device, visitor or public IP carries the worst band of its identifications in the selected period; only an identification has a numeric Risk Score. Local IPs appear as the optional **Local IP** column of the Identifications tab (add it with **Columns**) and as linked local IPs on each card, with the identifications behind each. [Users, devices, visitors and IPs](/concepts/entities) explains how the identities link.
## Band filters
The pills **Trusted**, **Suspicious** and **Dangerous** show how many rows of the tab fall in each band. Select one or more to filter the table and the chart. On the Identifications tab they filter by each identification's own Risk Score. On an identity tab they filter by the worst band in the period, so **Dangerous** on the Users tab lists every user with at least one Dangerous identification in the period.
 ## The chart
The chart shows how the selected tab moved over the period. Its bucket size follows the length of the period. On an identity tab each point counts the unique users, devices, visitors or IPs seen in that bucket, so the points do not add up to the tab's total. Active filters sit on the chart card as chips. Each chip shows its filter as field and value, such as `campaign:spring_promo`, with its count; a High-Risk Events chip shows no count. Remove one with its close button, or clear them all at once.
## Filters
**Filters** opens the list of fields on the left and their values on the right. Pick values, then select **Done** to apply them, or **Reset all** to start over. The fields are High-Risk Events, Country, Browser, OS, Device type, Connection type, Domain, Channel, Source, Campaign, Entry page and Risk signals.
The **High-Risk Events** field filters to one or more of the four events: Multi-accounting, Account sharing, Impossible travel and Account takeover. While this filter is active, a note shows when High-Risk Events were last evaluated.
## The chart
The chart shows how the selected tab moved over the period. Its bucket size follows the length of the period. On an identity tab each point counts the unique users, devices, visitors or IPs seen in that bucket, so the points do not add up to the tab's total. Active filters sit on the chart card as chips. Each chip shows its filter as field and value, such as `campaign:spring_promo`, with its count; a High-Risk Events chip shows no count. Remove one with its close button, or clear them all at once.
## Filters
**Filters** opens the list of fields on the left and their values on the right. Pick values, then select **Done** to apply them, or **Reset all** to start over. The fields are High-Risk Events, Country, Browser, OS, Device type, Connection type, Domain, Channel, Source, Campaign, Entry page and Risk signals.
The **High-Risk Events** field filters to one or more of the four events: Multi-accounting, Account sharing, Impossible travel and Account takeover. While this filter is active, a note shows when High-Risk Events were last evaluated.
 ## Saved views
**Views** keeps the filter combinations you use often. Name the current filters and select **Save current view**. A saved view can then be applied with **Apply**, renamed with **Rename**, replaced by the current filters with **Update**, or removed with **Delete**. Saved views are stored with your login, so they follow you to any browser you sign in from.
## The table
On the **Users**, **Devices**, **Unique visitors** and **Public IPs** tabs the columns are First seen, Last seen, the identifier, Risk (the band), Identifications, and how many users, devices, unique visitors, public IPs and public countries are linked to it. A tab leaves out its own count, so the Users tab has no Users column.
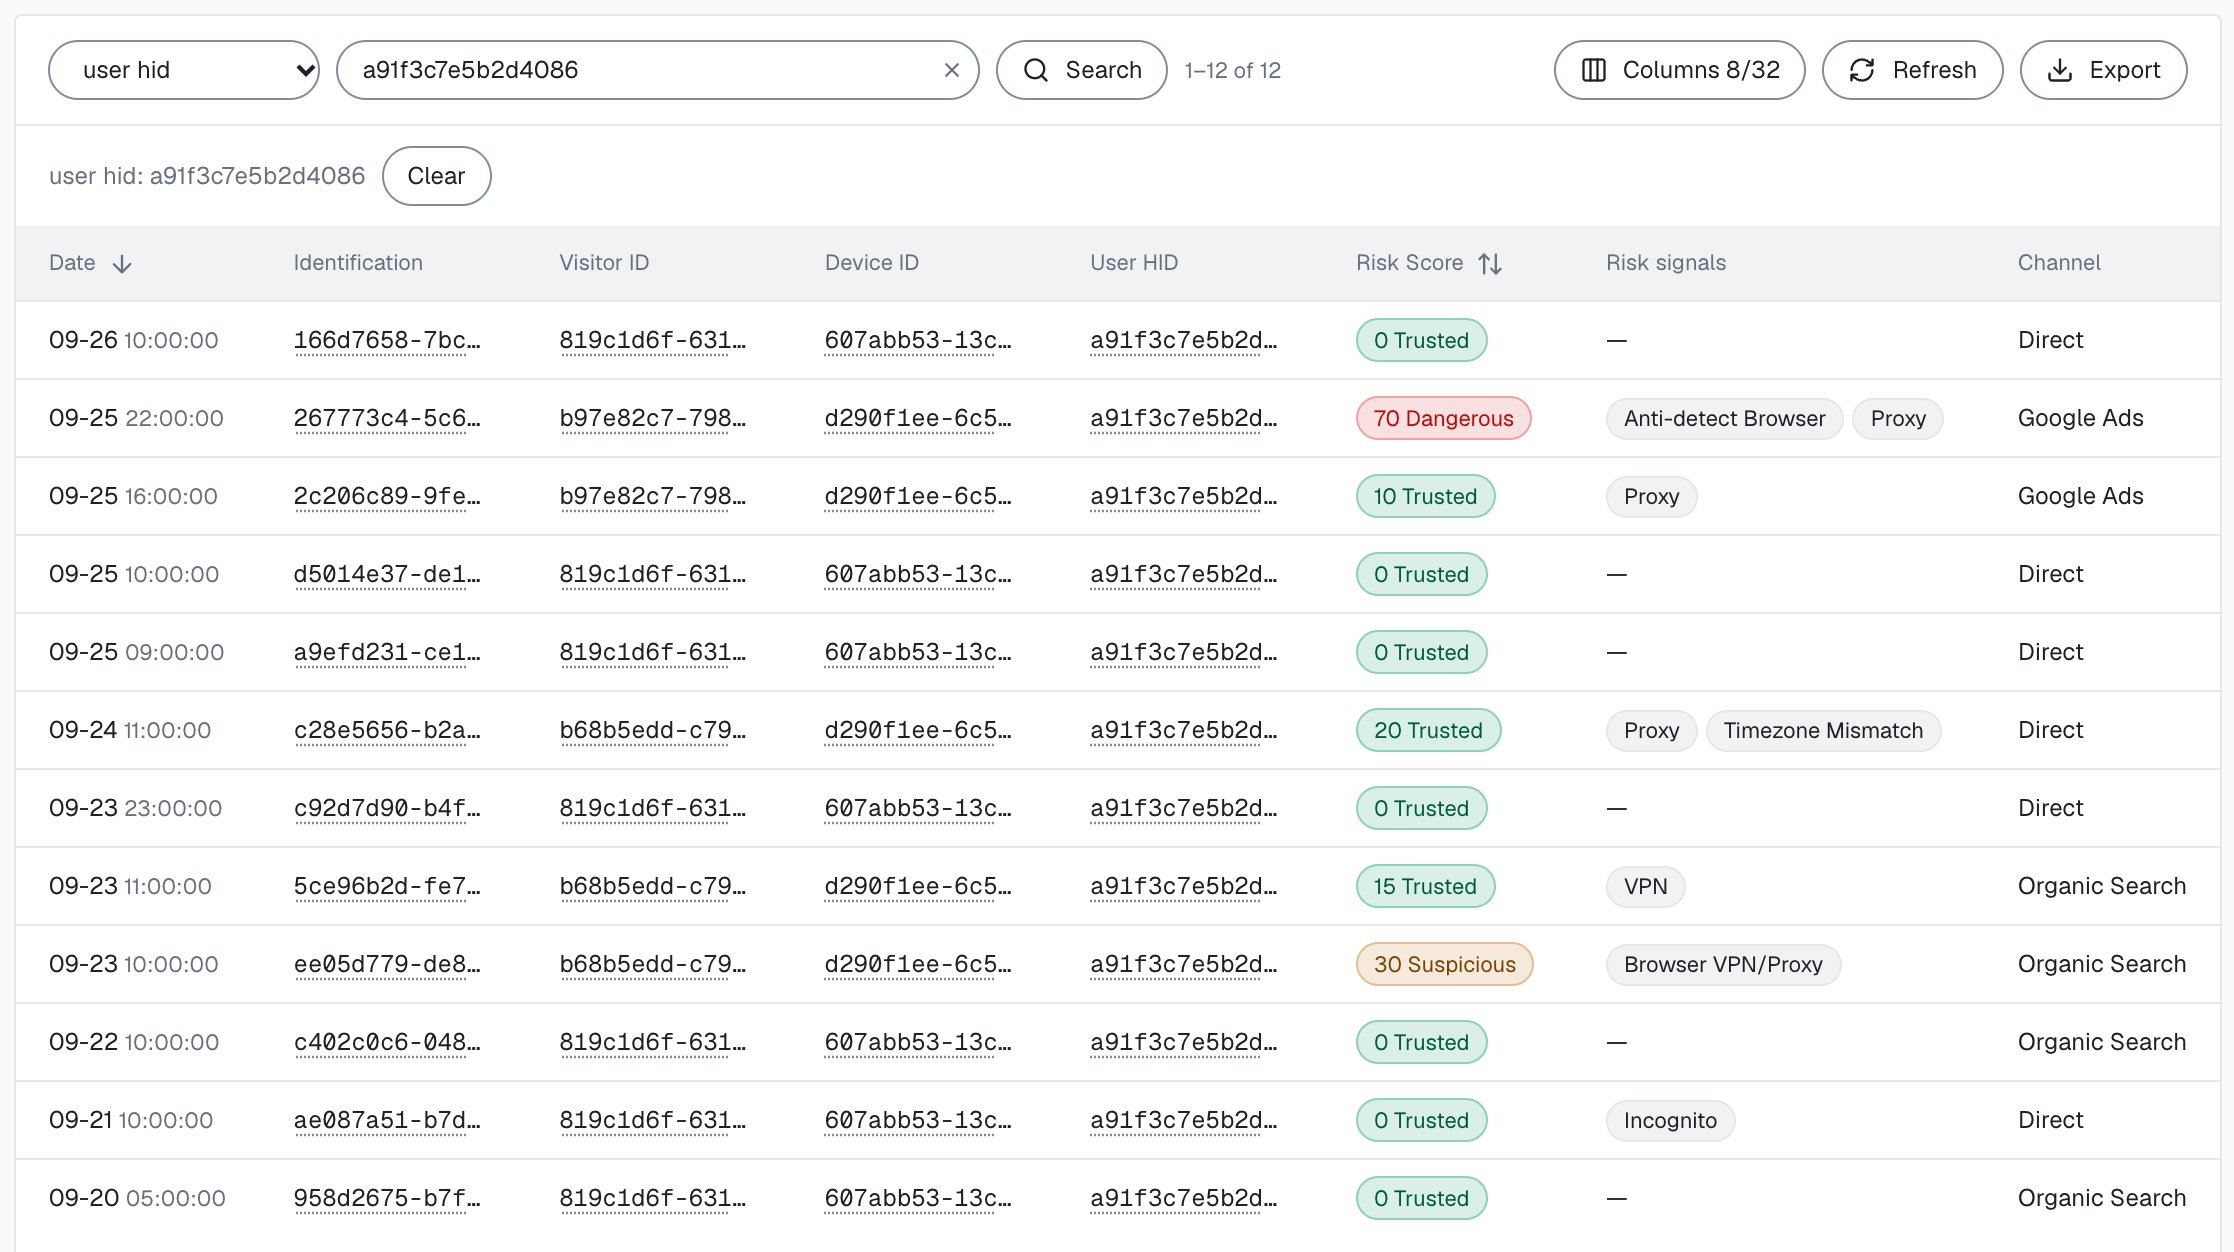
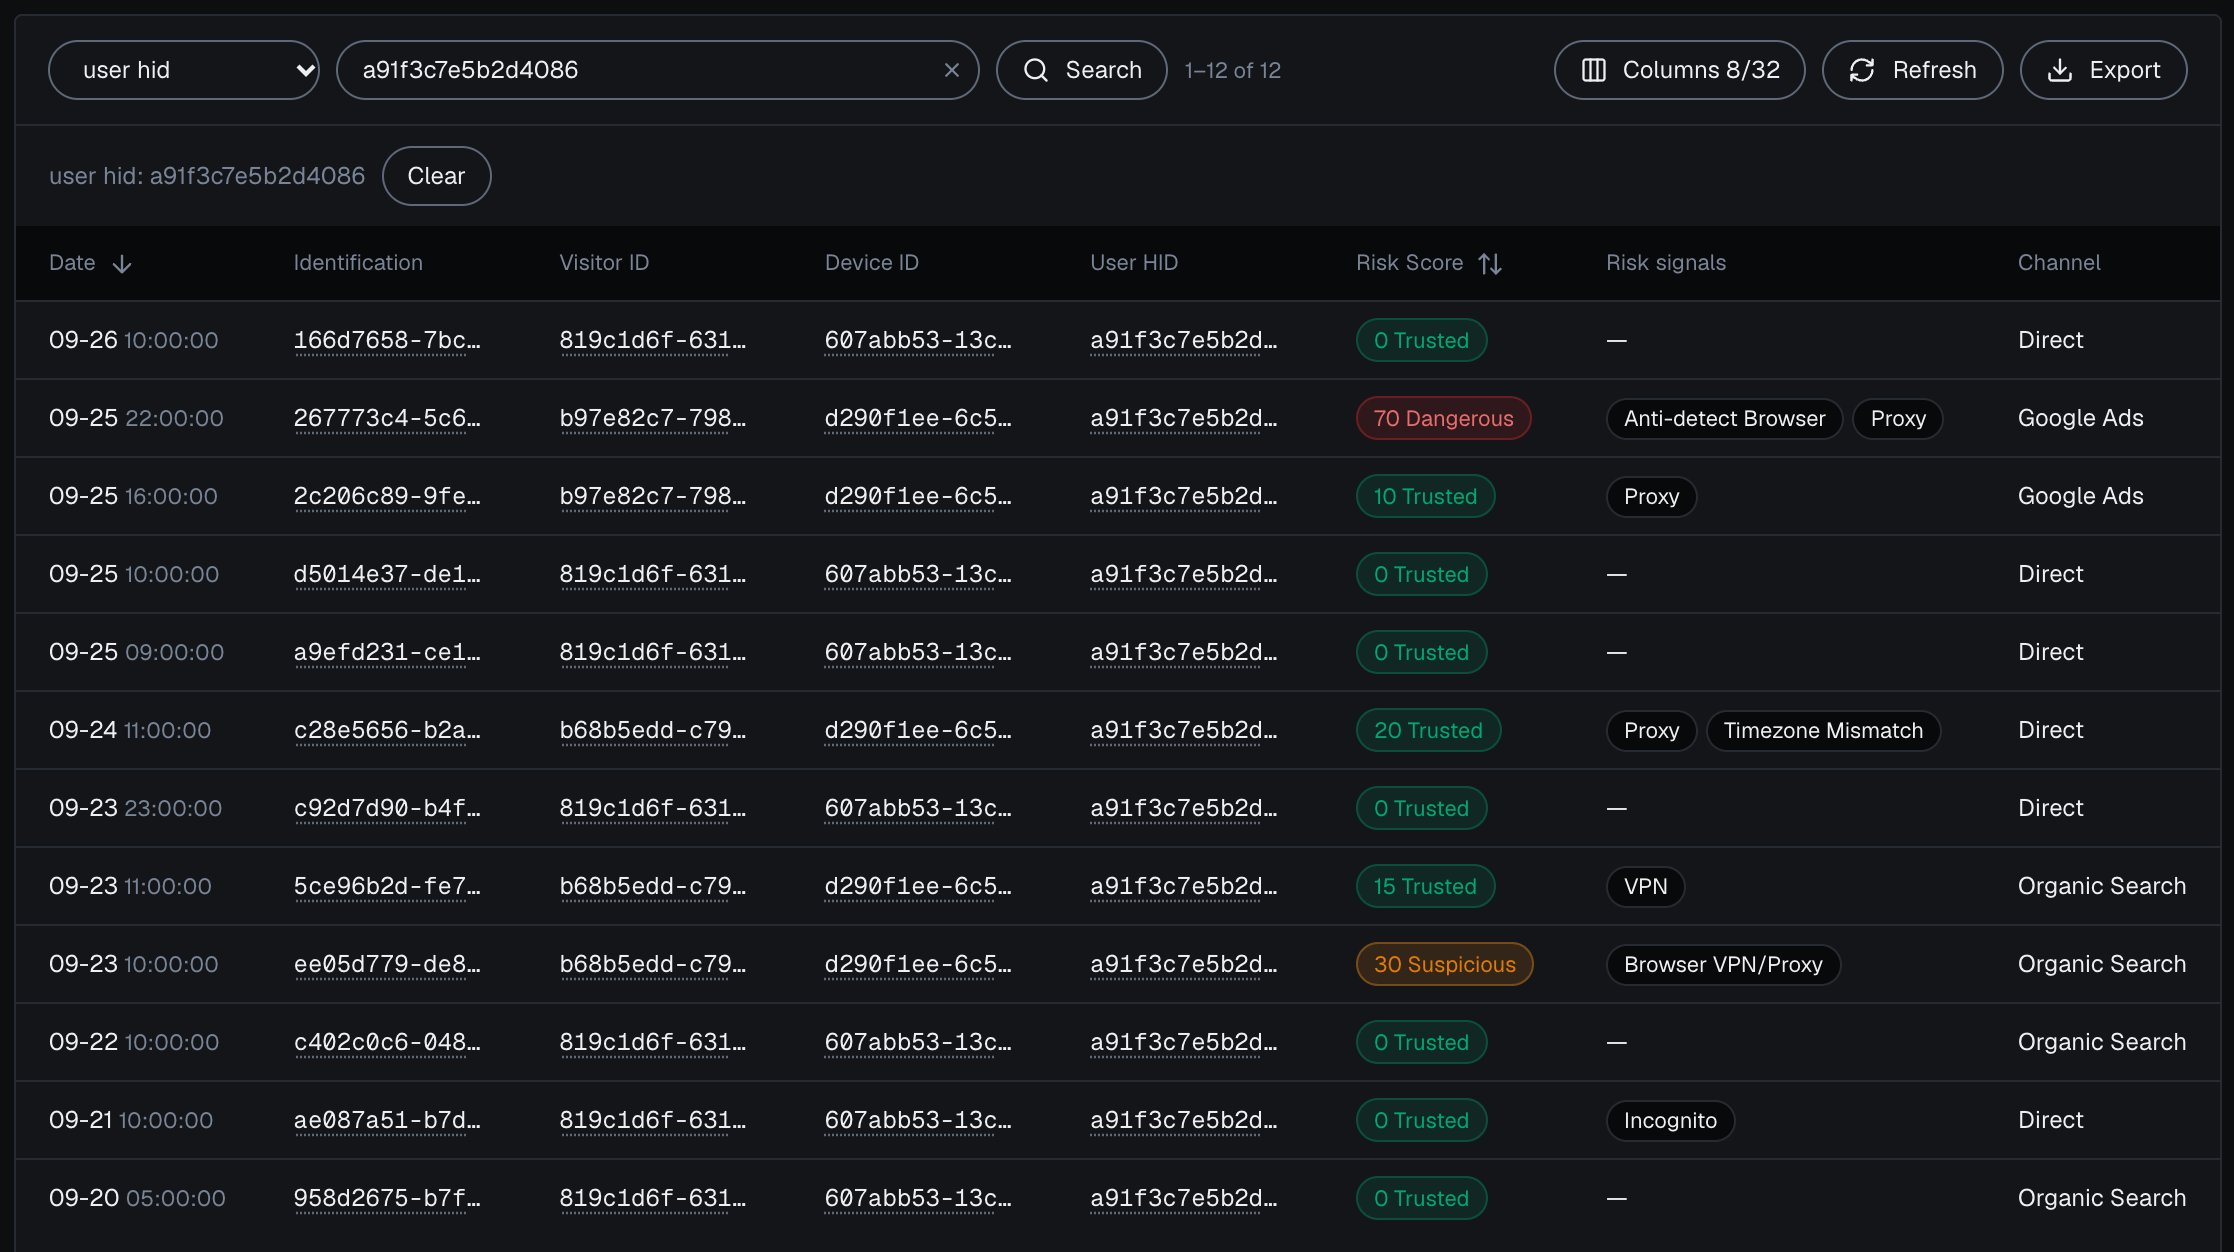
On the **Identifications** tab the columns include Date, Identification (the request ID), Visitor ID, Device ID, User HID, Risk Score, Risk signals, Public IP and Country. **Columns** adds Local IP, Local country, Session ID, Cookie ID, Browser, OS, Device type, Connection type, Domain and the traffic source fields: Channel, Referrer Domain, Campaign, Entry page and the UTM parameters. The **High-Risk Events**, **Device risk**, **Visitor risk**, **User risk** and **IP risk** columns are on by default and show a dash in the table; read the user's High-Risk Events and the risk of the user, device, visitor and IP behind each identification on the [identification card](/dashboard/identification-card) and the [user card](/dashboard/entity-card), or clear those columns in **Columns**. On the identity tabs, the **High-Risk Events** and **Risk signals** columns show a dash as well. The **Risk signals** column of the Identifications tab also names informational flags such as Incognito, which add nothing to the Risk Score.
Search finds one identifier. On an identity tab, search by that tab's own identifier. On the Identifications tab, leave the field on **auto** or pick one: request ID, Visitor ID, Device ID, User HID, Cookie ID, Session ID or IP. **Refresh** reloads the first page with the latest data.
## Export
**Export** downloads a CSV of every identification in the current filter, not only the page on screen. On an identity tab the export still holds identifications, one row each. An export covers up to 10,000 identifications; for a larger selection, narrow the period or add a filter. Exporting uses none of your included identifications.
## Saved views
**Views** keeps the filter combinations you use often. Name the current filters and select **Save current view**. A saved view can then be applied with **Apply**, renamed with **Rename**, replaced by the current filters with **Update**, or removed with **Delete**. Saved views are stored with your login, so they follow you to any browser you sign in from.
## The table
On the **Users**, **Devices**, **Unique visitors** and **Public IPs** tabs the columns are First seen, Last seen, the identifier, Risk (the band), Identifications, and how many users, devices, unique visitors, public IPs and public countries are linked to it. A tab leaves out its own count, so the Users tab has no Users column.
On the **Identifications** tab the columns include Date, Identification (the request ID), Visitor ID, Device ID, User HID, Risk Score, Risk signals, Public IP and Country. **Columns** adds Local IP, Local country, Session ID, Cookie ID, Browser, OS, Device type, Connection type, Domain and the traffic source fields: Channel, Referrer Domain, Campaign, Entry page and the UTM parameters. The **High-Risk Events**, **Device risk**, **Visitor risk**, **User risk** and **IP risk** columns are on by default and show a dash in the table; read the user's High-Risk Events and the risk of the user, device, visitor and IP behind each identification on the [identification card](/dashboard/identification-card) and the [user card](/dashboard/entity-card), or clear those columns in **Columns**. On the identity tabs, the **High-Risk Events** and **Risk signals** columns show a dash as well. The **Risk signals** column of the Identifications tab also names informational flags such as Incognito, which add nothing to the Risk Score.
Search finds one identifier. On an identity tab, search by that tab's own identifier. On the Identifications tab, leave the field on **auto** or pick one: request ID, Visitor ID, Device ID, User HID, Cookie ID, Session ID or IP. **Refresh** reloads the first page with the latest data.
## Export
**Export** downloads a CSV of every identification in the current filter, not only the page on screen. On an identity tab the export still holds identifications, one row each. An export covers up to 10,000 identifications; for a larger selection, narrow the period or add a filter. Exporting uses none of your included identifications.
 ## Open a row
Select the request ID in the Identification column to open that [identification card](/dashboard/identification-card). Select a User HID, Device ID, Visitor ID or Public IP anywhere in the table to open that identity's [card](/dashboard/entity-card). On an identity tab, the identifier in each row opens its card.
## Next steps
One account with its band, its High-Risk Events and everything linked to it.
The Risk Score and weighted risk signals of one identification.
From the Overview to one user card and an action in your backend.
The four events detected on your users, at Medium or High confidence.
Every risk signal you can filter by, with its weight.
Every identification of one account through the History API, by `user_hid`.
## Open a row
Select the request ID in the Identification column to open that [identification card](/dashboard/identification-card). Select a User HID, Device ID, Visitor ID or Public IP anywhere in the table to open that identity's [card](/dashboard/entity-card). On an identity tab, the identifier in each row opens its card.
## Next steps
One account with its band, its High-Risk Events and everything linked to it.
The Risk Score and weighted risk signals of one identification.
From the Overview to one user card and an action in your backend.
The four events detected on your users, at Medium or High confidence.
Every risk signal you can filter by, with its weight.
Every identification of one account through the History API, by `user_hid`.